
Figure 3.
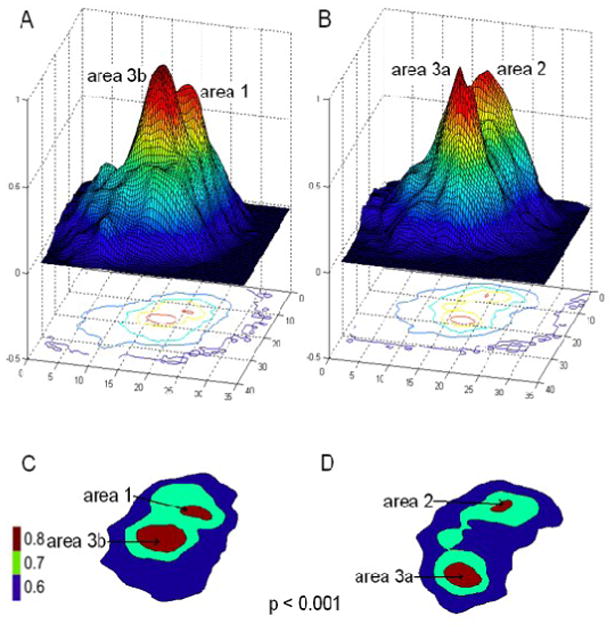
Differential functional connectivity patterns in SI cortex. A & B: 3D Correlation patterns of area 3b seed and area 3a seed, respectively. C&D: 2D plot of thresholded correlation map at r=0.7 (gray) for both area 3b and 3a. Color scale bar: r-values.