
Figure 4.
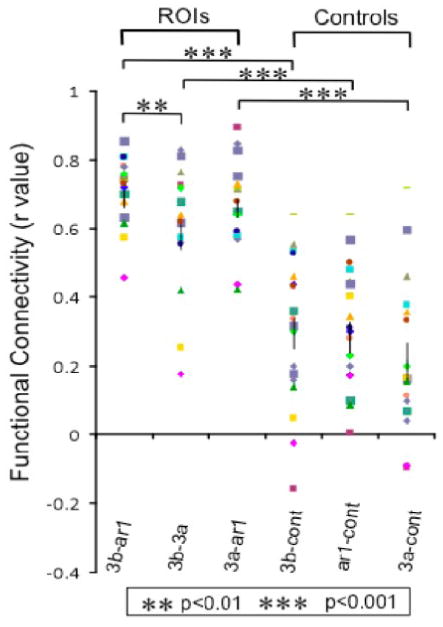
Grouped r-values of correlations between 6 pairs of ROIs. Each symbol represents measures from one imaging run. Correlation between area 3b and area 1 was significantly higher than correlations between area 3a and area 3b (p<0.01). Additionally, correlations between digit areas were significantly stronger than their correlations with control ROIs (p<0.001)