
Figure 5.
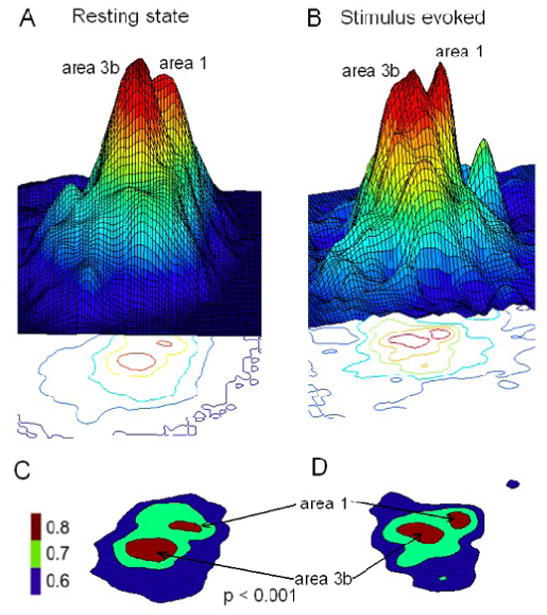
A & B: 3D Correlation pattern from resting state and stimulus driven activation map for seed voxel in area 3b. C & D 2D plots thresholded at r = 0.6. Color scale bar: r-values.
Official websites use .gov
A
.gov website belongs to an official
government organization in the United States.
Secure .gov websites use HTTPS
A lock (
) or https:// means you've safely
connected to the .gov website. Share sensitive
information only on official, secure websites.
A & B: 3D Correlation pattern from resting state and stimulus driven activation map for seed voxel in area 3b. C & D 2D plots thresholded at r = 0.6. Color scale bar: r-values.