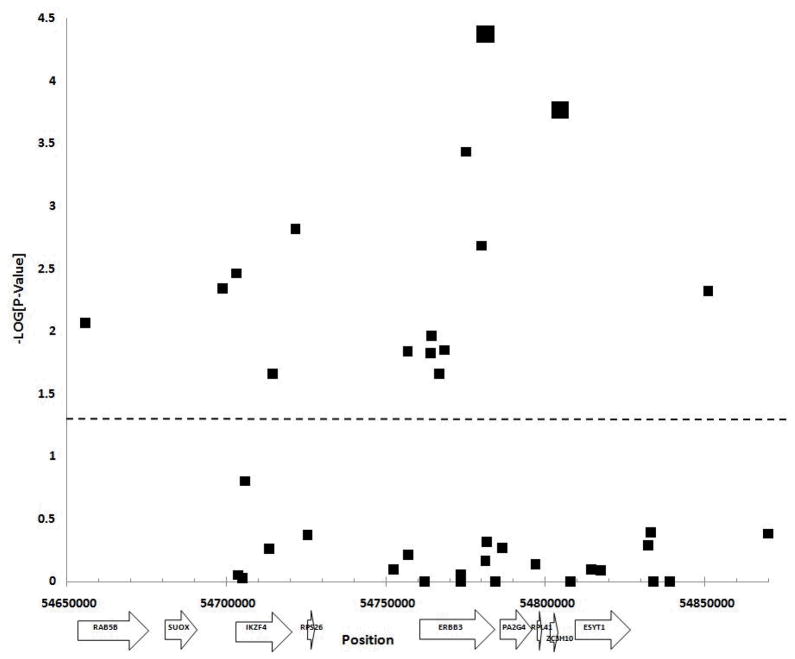
Figure 1. Plot for Association with T1D.
Association plot for single SNP associations with type 1 diabetes. The SNP position and -LOG (P-Value) are plotted on the X and Y axis respectively. All symbols above the dashed line represent a significant association (P ≤ 0.05). SNPs rs2271189 and rs11171747 are represented by larger black squares.

