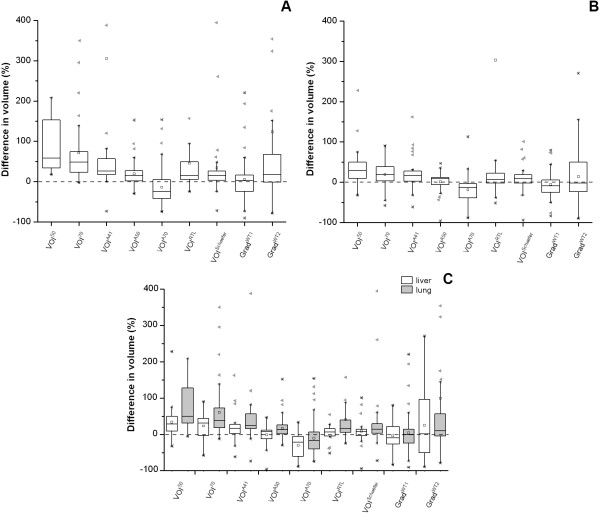
Figure 2.
Box-and-whisker plots of the percentage differences between measured volumes derived from SUV and Patlak images. Box-and-whisker plots of the percentage differences between measured volumes derived from SUV and Patlak images for different tumor delineation methods in (A) NSCLC and (B) GI cancer, and (C) the pooled data from both studies specified per location, i.e., the liver and the lung. The median is the horizontal line between the lower (first) and upper (third) quartiles. Empty square represents the average value, cross, the minimum and maximum values, and filled left-pointing pointer, the number of statistical outliers. The percentage difference was defined as .

