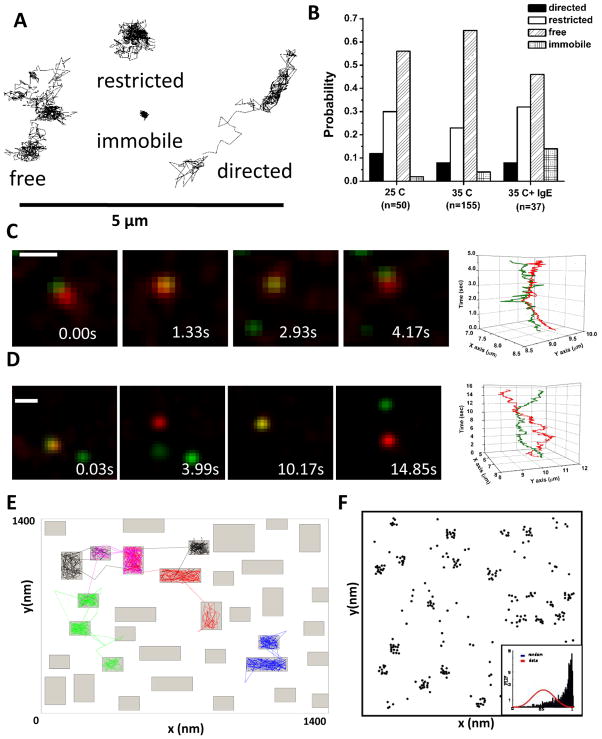
Figure 2. Characterizing FcεRI diffusion.
(A) Example trajectories of individual FcεRI motion as determined by single quantum dot tracking. The expected four modes of motion are observed: free, restricted, directed and immobile (see Andrews et al., 2008). (B) Distribution of the modes of motion under different conditions. (C,D) Two-color imaging allows us to simultaneously track receptors labeled with QD655-IgE and QD585-IgE. Note that receptors often maintain close proximity but do not demonstrate correlated motion, indicating that the close proximity is due to co-confinement in a microdomain, not receptor interactions.35 (E) Example simulation from the Constrained Brownian Motion algorithm. Proteins in the simulation are considered as individual particles or agents that move at each time step (see ref 44). The membrane can be further subdivided into domains that are lipid-rich (fast diffusion for proteins, white space) and protein-rich (2-fold slower diffusion for proteins in the simulation, grey regions). Slower movement of receptors through the protein-rich domains leads to clustering of resting receptors (F) similar to that seen in electron microscopy images (Fig 1).

