Figure 3.
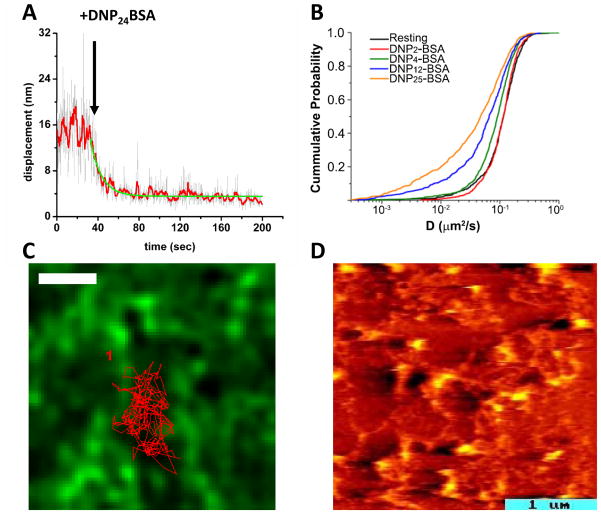
(A) Plot of the average displacement of QD-IgE-FcεRI complexes between subsequent frames over the time course of a single movie. After addition of 1 μg/ml DNP24-BSA, the displacement is seen to rapidly decrease, indicating a slow-down in receptor mobility (see ref 35). Red line is 10 frame averaging. Green line is exponential fit to the decay. (B) Cumulative Probability Analysis plot comparing the diffusion coefficients (D) of QD-IgE-FcεRI before and after crosslinking with antigens of different valency. Note that with DNP2-BSA (red) receptor mobility did not change from resting (black) even though degranulation was seen under these conditions. Higher valencies did cause receptor slow-down, presumably due to the formation of larger aggregates (see ref 36). (C) Tracking of QD-IgE-FcεRI on cells expressing GFP-actin (green) shows that the receptor trajectory (red line) is confined by the actin cytoskeleton (green). Here, cells were treated with PMA that stabilized the actin filaments (see ref 35). Scale bar, 1um. (D) AFM image revealing the topography of the cytoplasmic face of an RBL membrane sheet. The image is pseudo-colored to indicate heights ranging from 5–6 nm (dark red, the width of a lipid bilayer) to 30 nm (hot yellow) above the substrate. Raised domains dot the landscape and are connected by many thin filaments.60

