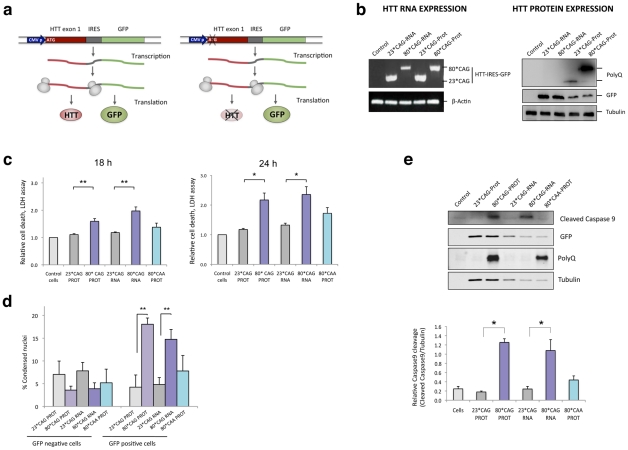
Figure 1. CAG-expanded exon 1 of human HTT is toxic at the RNA level.
A. CAG-unexpanded (wild-type; 23 CAG repeats) and CAG-expanded (mutant; 80 CAG repeats) constructs of human HTT exon 1 (HTT exon 1) were subcloned into a pIRES-EGFP vector. Each variant was produced as a normal translated form (left) and a form lacking the translation initiation codon (right). The specific role of the expanded protein was analyzed with a construct expressing CAA-expanded HTT-e1. The use of IRES-based bicistronic vectors with a GFP reporter allows monitoring of transfected cells. B. The four different constructs express the mRNA HTT-IRES-GFP (left) and the GFP reporter protein (right). HTT protein is only expressed in the constructs containing the ATG translation initiation codon (right). C. Differentiated SH-SY5Y cells were transfected with the HTT-IRES-GFP vectors and LDH cell toxicity assay was performed 18 h and 24 h after transfection. Expression of CAG-expanded HTT (RNA or protein) resulted in dramatic cell death. CAA-expanded HTT-e1 didn't induce a significant effect on cell viability at the time points analyzed (n = 4; *p<0.05, **p<0.01, ***p<0.001). D. The percentage of dead transfected cells was also determined 36 hours after transfection by counting 200 GFP-negative cells (left) and 200 GFP-positive cells (right), scoring in each case the presence of nuclear fragmentation. Values represent the percentage of cells showing nuclear condensation in each situation ± SD (n = 3; **p<0.01). E. Expression of CAG-expanded HTT RNA induced caspase 9 cleavage. GFP blots highlight the expression of all constructs in transfected cells and polyglutamine (PolyQ) blots show expression of expanded HTT protein. Densitometry determinations of cleaved caspase 9 vs. α-Tubulin were performed on cells lysated 24 hours after transfection. Results are presented as the mean of arbitrary optical density units (O.D. units ± SEM; n = 3; *p<0.05, ***p<0.001). In C. and E., values represent the mean fold change with respect to the control non-transfected cells ± SEM.

