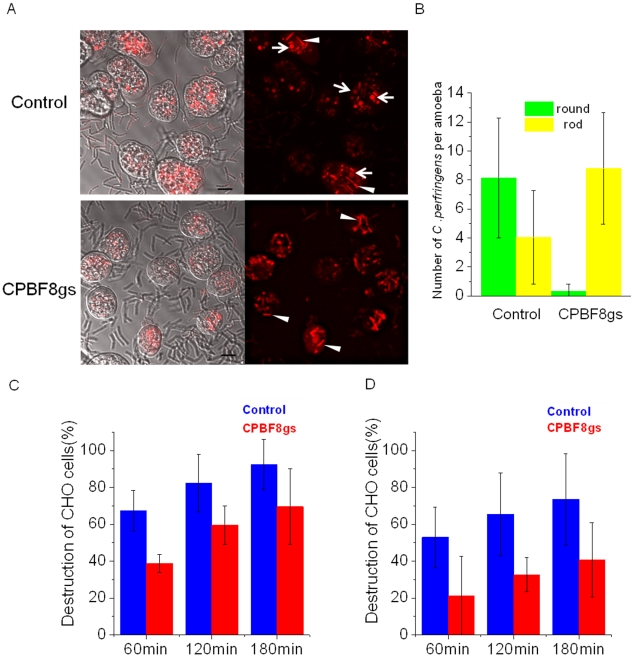
Figure 5. Effects of CPBF8 repression on the digestion of C. perfringens and destruction of CHO monolayers.
(A) Micrographic images of control and CPBF8gs strains coincubated with C. perfringens. Approximately 1.5×10⁴ cells of the control and CPBF8gs strains were incubated with 1.5×10⁶ C. perfringens, pretreated with 10 µM of SYTO-59. After 4 h co-incubation, amoebas were washed and microscopically examined. Bar, 10 µm. Arrows indicate representative round shape “deformed” or “damaged” C. perfringens. Arrowheads indicate representative rod-shaped “intact” C. perfringens. (B) Quantitative analysis of rod-shaped and round C. perfringens in the control and CPBF8gs strains. Data shown are the means ± standard deviations of 20 independent cells. (C, D) Kinetics of CHO cell destruction by the control and CPBF8gs strains. Approximately 5×10⁴ cells of the control and CPBF8gs strains, untreated (C) or pretreated with 200 µM of E-64 for 2 h and washed with PBS (D), were added to a monolayer of confluent CHO cells in 24 wells and incubated at 35°C for the indicated times. Data shown are the means ± standard deviations of four independent experiments. Monolayer destruction is expressed as the percentage of destroyed CHO cells. Data shown are the means ± standard deviations of four independent experiments.

