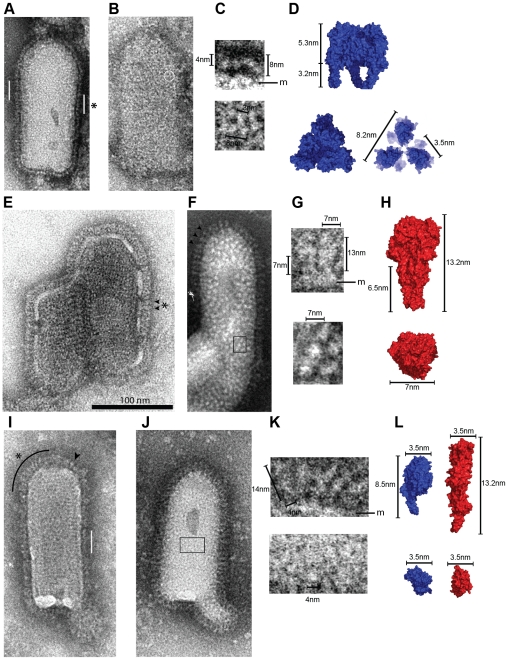
Figure 7. Morphology of G at the surface of negatively stained VSV particles at pH 7.5, 6.7 and 6.0.
(A–B) VSV particles incubated at pH 7.5. G molecules form a thin and continuous layer of 8 nm height all around the viral particle. The white bars in A indicate areas where an even layer of G is visible. The circle on the viral particle in B shows a pre-fusion trimer of G in top view (Note that only a few trimers are visible). (C) Higher magnification of G layer region indicated by an asterisk in A (top) and of G pre-fusion trimer in top view located inside the circle in B (bottom). (D) Space filling model of VSV G X-ray trimer in its pre-fusion conformation as viewed from the side and from the top. The top view on the right is a clipped view of VSV G that illustrates what G pre-fusion trimers looks like at the viral surface. (E–F) VSV particles incubated at pH 6.0. Spikes are more elongated and can easily be seen individually. Arrowheads indicate some individual post-fusion trimers viewed from the side. Note that in panel F their regular spacing is particularly visible. Spikes can also be seen from the top in F, forming white domains having a diameter of about 7 nm. (G) Higher magnification of the region indicated by an asterisk on E showing spikes viewed from the side (top) and of the boxed region in F showing post-fusion trimers viewed from the top. (H) Space filling model of VSV G trimer in its post-fusion conformation as viewed from the side and from the top. (I–J) VSV particles briefly incubated at pH 6.7. G molecules form an irregular layer all around the viral particle. The white bar in I indicates an area with a layer of G that have kept their high-pH organization. The arrowhead in I points to a spike in its post-fusion conformation. The black line in I indicates an area where G forms a fuzzy heterogeneous layer in which some elongated rod like shape structures can be observed. Glycoproteins can also be seen from the top in J, forming small white domains having a diameter of about 4 nm. (K) Higher magnifications of G layer region indicated by an asterisk in I (top) and of the boxed region in J showing top views of G at the viral surface (bottom). (L) Space filling model of VSV G protomer in pre-fusion (in blue) and post-fusion (in red) conformations as viewed from the side and from the top. All VSV particles (A, B, E, F, I, J) are at the same scale (scale bar for 100 nm n in E). The images in C, G, and K are enlargements of these particles (magnification X4). Measurements and membrane location (m) are indicated.

