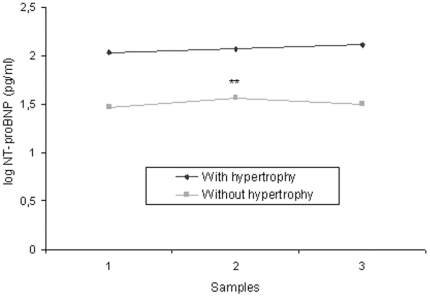
Figure 1. Serum logarithm of NT-proBNP levels during a 24-month follow-up.
Measurements represent the median value at basal (1), stage I (2) and stage II (3). NT-proBNP, N-terminal pro-brain natriuretic peptide levels; stage I, 12-month follow-up; stage II, 24-month follow-up. **p<0.01 with respect to basal levels.

