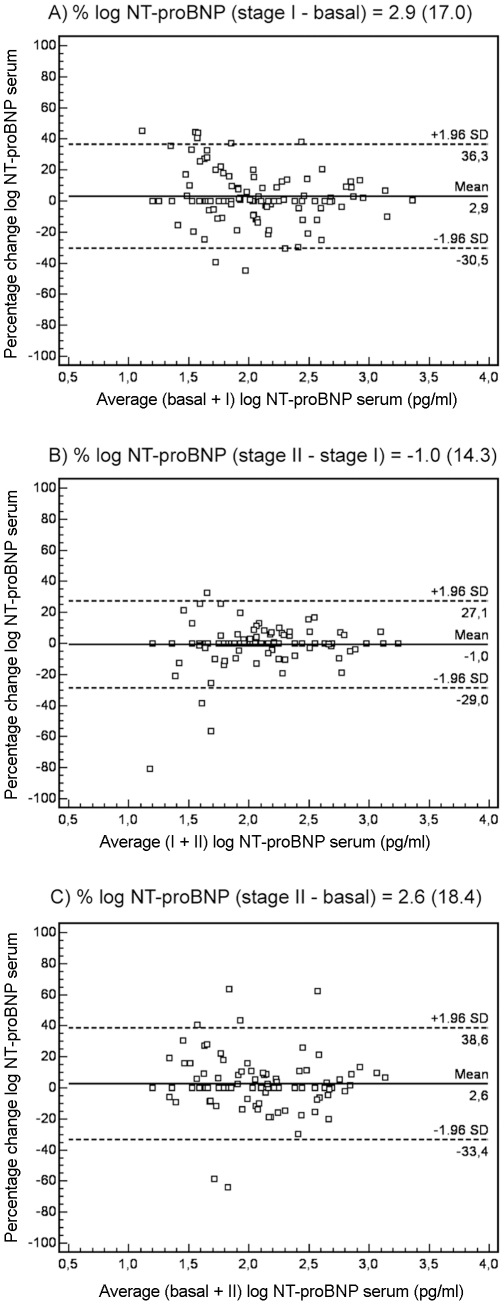
Figure 2. Bland-Altman plots for changes in NT-proBNP serum levels in hypertensive patients with hypertrophy.
Bland-Altman plot showing agreement between the logarithm of NT-proBNP levels percentage change against the average of the logarithm of NT-proBNP levels in basal + stage I (A), stage I + stage II (B) and basal + stage II (C). The solid line represents the mean of the percentage change. The dashed lines define the limits of agreement (standard deviation of percentage of change ×1.96 SD). NT-proBNP, N-terminal pro-brain natriuretic peptide levels; SD, standard deviation; stage I, 12-month follow-up; stage II, 24-month follow-up.

