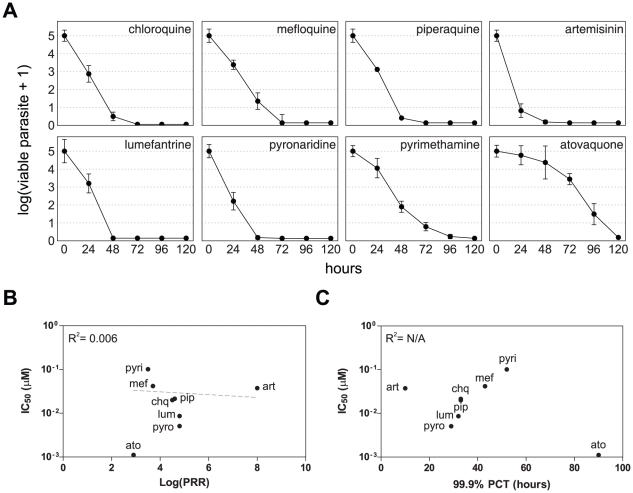
Figure 3. Parasite viability in response to various classical antimalarial drugs.
A. P. falciparum viability time-course profiles for chloroquine (chq), mefloquine (mef), piperaquine (pip), artemisinin (art), lumefantrine (lum), pyronaridine (pyro), pyrimethamine (pyri), and atovaquone (ato). Error bars represent the SEM of at least 4 independent experiments. B. and C. Scatter plots of the compounds tested reporting the IC50 versus the log(PRR) and 99.9% PCT, respectively. The dotted line in panel B is a log linear regression, the slope thereof is not significantly different from zero (p = 0.48). Data of panel C do not converge enough to establish a regression line.

