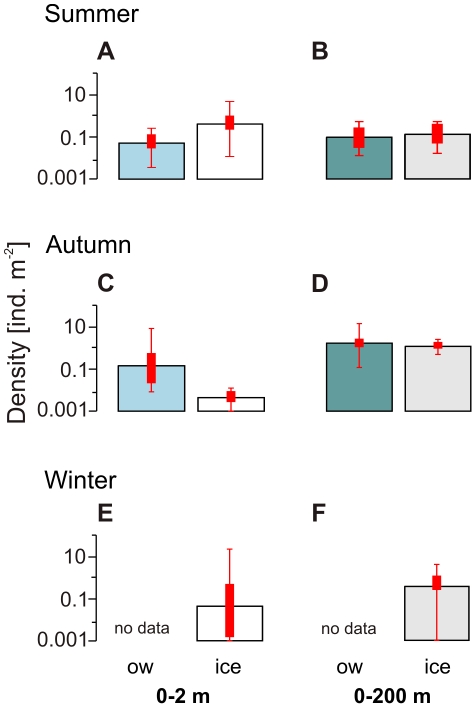
Figure 4. Under-ice versus open water comparison of geometric mean densities of postlarval Euphausia superba in (A–B) summer (2007/2008), (C–D) autumn (2004), and (E–F) winter (2006).
(A, C, E) Euphausia superba from the 0–2 m layer, and (B, D, F) from the 0–200 m layer. Error bars denote value ranges. Bold red bars indicate 25% to 75% percentile ranges. ice = under-ice, ow = open water SUIT hauls.

