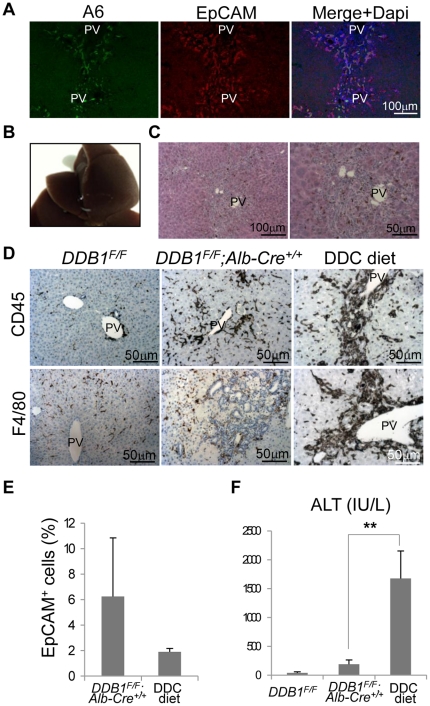
Figure 5. DDB1 mutant mice exhibit minor liver damage compared with DDC-treated mice.
(A): Co-IF staining for A6 and EpCAM on liver sections from DDC-treated mice. (B): Gross appearance of liver from mice fed with DDC diet for 4 weeks. (C): H&E staining of the liver in (B). (D): IHC staining for CD45 (upper panels) and F4/80 (lower panels) on liver sections from DDB1F/F, DDB1F/F;Alb-Cre+/+ and DDC-treated mice. (E): Percentage of EpCAM+ cells from DDB1F/F;Alb-Cre+/+ and DDC-diet liver, determined by FACS analysis. Data are representative of 4 independent experiments with 3 mice per group in each experiment. Values are expressed as the means±SEM; n = 3. (F): Serum alanine aminotransferase (ALT) levels. Data are representative of 4 independent experiments with 3 mice per group in each experiment. Values are expressed as means±SEM; n = 3 **P<0.01.

