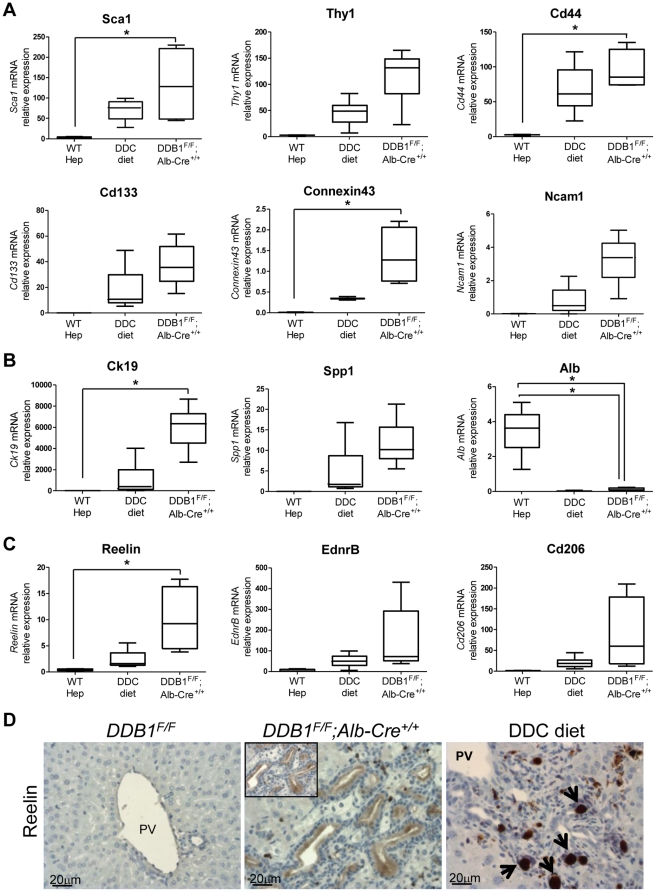
Figure 6. Characterization of OCs from DDB1 mutant mice and DDC-treated mice.
(A–C): Quantitative real-time PCR analysis for selected genes expressed in hepatocytes isolated from wild type mice, and EpCAM+ cells isolated from DDC-treated and DDB1F/F; Alb-Cre+/+ mice. All data are normalized to 18s rRNA level. Data are representative of 4 independent experiments with 3–4 mice per group. *P<0.05 (A): Expression levels of hematopoietic markers Sca1, Thy1 and Cd44, and OC markers CD133, Connexin43 and Ncam1. (B): Expression levels of cholangiocyte marker Ck19 and Spp1, and hepatocyte marker Alb. (C): Expression levels of candidate OC markers, Reelin, EdnrB and Cd206. (D): IHC staining for reelin on liver sections from DDB1F/F, DDB1F/F;Alb-Cre+/+ and DDC-treated mice. Arrows in DDC-treated liver indicate non-specific brown deposits.

