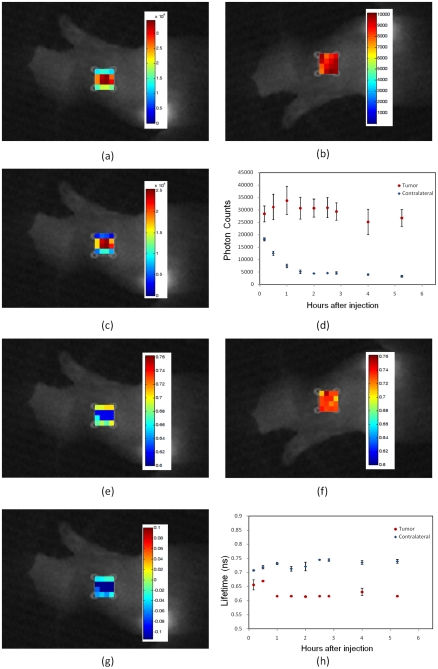
Figure 6. In vivo fluorescence imaging of xenograft mouse with high HER2-expressing human tumor model (NCI-N87) after injection of the HER2 specific Affibody® (His6-ZHER2:GS-Cys) conjugated to Dylight750.
(A) Fluorescence intensity map at the tumor region. (B)Fluorescence intensity map at the contralateral site. (C) The difference of fluorescence intensity at the tumor region and the contralateral site, mapped on the tumor region. (D) Pharmacokinetics of the fluorescence intensity at the tumor region and contralateral site after the injection over time. The data in Figs. (D) and (H) are the average data of three mice. Markers show the average and bars show the standard deviation. (E)Fluorescence lifetime map at the tumor region. (F) Fluorescence lifetime map at the contralateral site. (G) The difference of fluorescent lifetime at the tumor and the contralateral site mapped on the tumor region. (E) Pharmacokinetics of the fluorescent lifetime at the tumor region and contralateral site after injection over time.

