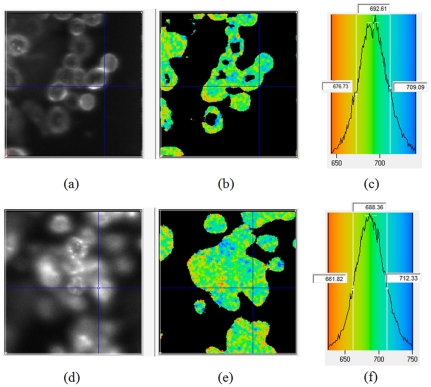
Figure 11. In-vitro image of HER2 positive cancer cells (SKBR3) exposed to HER2-Affibody-Dylight750 in (A–C) PBS and (D–F) cell culture with 10% FBS.
Figures (A) and (D) show the intensity and (B) and (E) show the lifetime image. The histogram of the lifetime distribution has been shown in figures (C) and (F) for PBS and 10% FBS in cell culture media, respectively.

