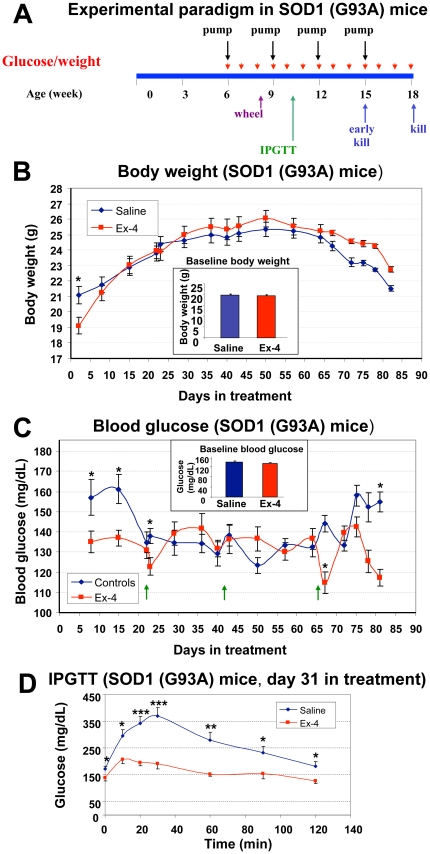
Figure 4. Design of animal study and gluco-regulatory effects of Ex-4 in SOD1 (G93A) mice.
(A) Scheme of animal study: SOD1 (G93A) mice were assigned to two groups (n = 15 mice/group), starting at the age of 6 weeks, saline or Ex-4 was delivered via subcutaneously implanted osmotic pumps in the control group and Ex-4 treatment group, respectively, throughout the study (treatment duration 12 weeks, hence mice were 18-weeks old at endstage) and pumps were changed every 3 weeks. (B) Baseline and weekly body weight of control (saline) and Ex-4-treated SOD1 (G93A) mice were largely similar throughout the study. Both mean baseline and weekly body weights were not different between the two groups of SOD1 (G93A) mice, except at the first measurement on day 2 post-treatment, when the body weight of Ex-4 treated mice transiently dropped compared to controls. The mean body weight of the Ex-4 group thereafter quickly caught up and remained comparable to controls throughout the study (n = 10–15, * p<0.05). (C) Baseline and weekly blood glucose levels of saline or Ex-4-treated SOD1 (G93A) mice. Morning fed blood glucose levels were measured weekly from tail tips. In general, blood glucose levels in Ex-4 treated mice were regulated between 120–140 mg/dL, whereas those for controls varied between 125–160 mg/dL. Mean blood glucose levels were largely comparable between the two groups, except during the first 2 weeks and last week of the study, when levels were significantly higher in the control group (n = 10–15, * p<0.05). (D) Intraperitoneal glucose tolerance test (IPGTT) at day 31 of treatment in SOD1 (G93A) mice. Assessment of mean blood glucose levels during a 2-hour IPGTT demonstrated significantly lower levels in Ex-4-treated mice at all time points (0, 10, 20, 30, 60, 90, 120 min) measured during IPGTT (n = 7, * p<0.05).

