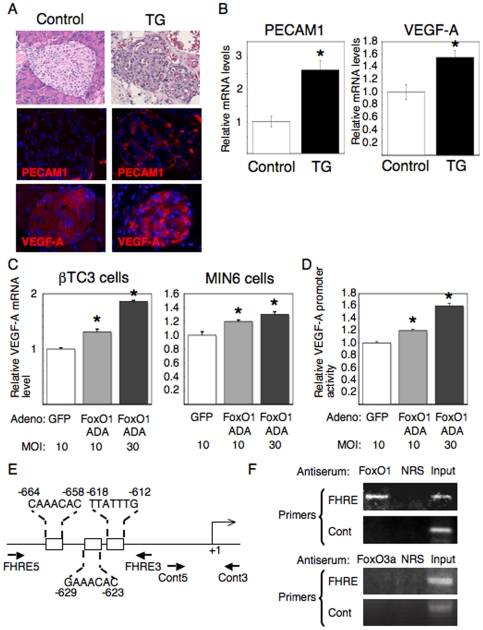
Figure 4. Islet vasculature and VEGF-A expression in β cells are increased in TG mice via FoxO1 regulation of VEGF-A transcription.
(A) Hematoxylin and eosin (HE) staining and immunohistochemistry with anti-PECAM1 or anti-VEGF-A antibodies in pancreatic sections from 2 month old TG and control mice. Representative images are shown. (B) Islets were isolated from TG and control mice and used for analyses by real-time RT-PCR to quantify PECAM1 and VEGF-A mRNA levels. In each experiment (A and B), six male and six female mice were analyzed for each genotype. There was no difference between male and female mice. Data represent the mean ± SEM fold-increase relative to control mice. An asterisk indicates P<0.05 by ANOVA. (C) β TC3 or MIN6 cells were infected with adenoviruses expressing FoxO1 ADA or GFP at indicated MOI, 24 hrs later mRNA was isolated from the cells and used for real-time RT-PCR to quantify VEGF-A mRNA levels. The results of (B) and (C) were normalized using GAPDH. (D) VEGF-A promoter driven luciferase activities were measured in MIN6 cells infected with adenoviruses expressing FoxO1 ADA or GFP at indicated MOI. For (C) and (D), data represent the mean ± SEM fold-increase relative to GFP infection. An asterisk indicates P<0.05 by ANOVA. (E) The promoter region of the mouse VEGF-A gene. Square indicates the location of the forkhead responsive element (FHRE). For ChIP assays, a primer set spanning three FHREs and control primers were used. An arrow indicates the initiation site of RNA synthesis and is designated +1. (F) ChIP assays of the VEGF-A promoter are shown. We performed ChIP assays in MIN6 cells with indicated antisera. NRS indicates normal rabbit serum used as a control antisera. The crosslinked DNA was amplified by PCR using FHRE and Cont primers. Input represents DNA extracted from chromatin prior to immunoprecipitation. We used input DNA with 1∶100 dilution.

