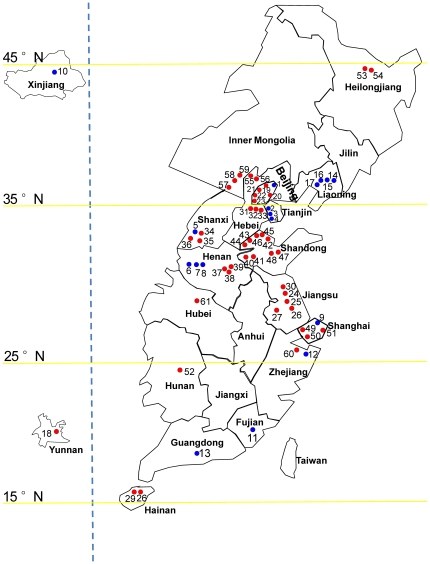
Figure 1. The collection sites of the 61 field populations of B. tabaci in China in 2009.
The numbers on the map correspond to the codes of the 61 populations in Table S1. The provinces of China in which no samples were collected are not included in this map. The vertical blue dot line indicates deletion of the central provinces between the western and the eastern provinces of China. Beijing, Tianjin and Shanghai cities are disproportionally enlarged. The filled blue and red circles represent B- and Q-biotype populations, respectively.

