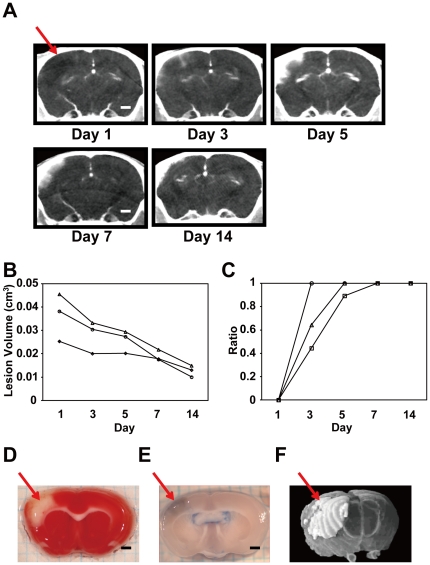
Figure 1. Temporal changes in cerebral lesions in the MCAO mouse infarction model.
A. Representative serial CECT images acquired from the same MCAO mouse brain scanned over a two week period. The red arrow indicates the infarct region. B. Quantitative changes in the lesion area of the MCAO brain over time. Changes in lesion volumes of three MCAO mice through days 1 and 14 were plotted. C. Progressive changes in the ratio of the HAA (%HAA) in the same MCAO mice shown in B. D. A coronal brain slice of an MCAO mouse on day 7 stained with TTC. The ischemic lesion is indicated by the arrow. E. Increased vascular permeability in the lesion shown by Evans blue leakage. F. A three-dimensional (3-D) image of the infarct area in an MCAO brain (white area, arrow) reconstructed from sequential coronal CECT images. All scale bars indicate 1 mm (A, D, E).

