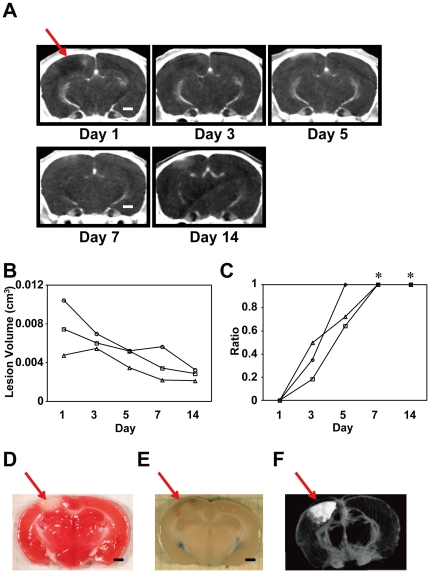
Figure 2. Temporal changes in the infarct area in the PIT-BD mouse model.
A. Serial CECT images taken from a representative PIT-BD mouse brain. B. Time-dependent changes in %HAA and total volume of lesion. Changes in lesion volumes of three MCAO mice through days 1 and 14 are shown. C. Temporal changes in %HAA in the same PIT-BD mice shown in B. There were significant differences in %HAA between day 1 and days 7 and 14 (Kruskal-Wallis test with Dunn's post-hoc tests, *P<0.05). D. A TTC-stained coronal section of a PIT-BD mouse brain on day 7. The arrow indicates the ischemic lesion. E. Leakage of Evans blue indicating elevated vascular permeability in the infarct area. F. A 3-D image of the PIT-BD lesion (white area) reconstructed from sequential CECT images. Scale bars: 1 mm (A, D, E).

