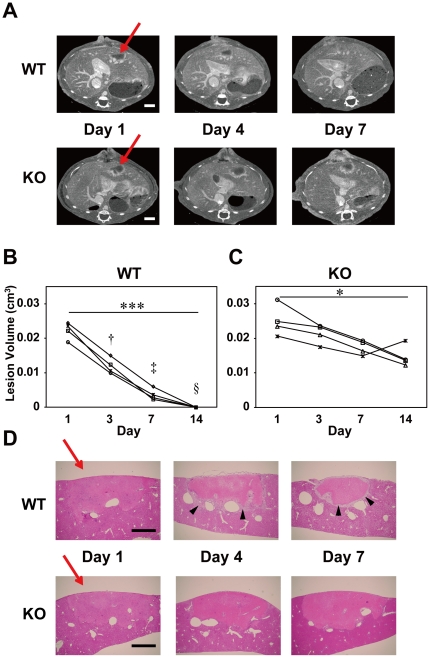
Figure 3. Differences in the temporal changes in liver lesions between the WT and plasminogen KO mice.
A. CECT scans showing time-dependent recovery from PIT-LD liver injury in wild-type (WT), but not in the plasminogen-knockout (KO) mouse. The arrows indicate areas of photochemically induced injury. Scale bars indicate 2 mm. B. Quantitative evaluation of the recovery process from the liver damage in the WT mice. Changes in lesion volumes in WT PIT-BD mice from day 1 through day 14 are shown (n = 4). Kruskal-Wallis test with Dunn's post-hoc tests indicated a significant difference in the lesion volumes between days 1 and 14 (***, p<0.001). Two-way ANOVA with Bonferroni post-hoc tests revealed significant differences in the lesion volumes between WT and KO mice on days 4 (†, P<0.001), 7 (‡, P<0.0001) and 14 (§, P<0.0001). C. Changes in the lesion volume in livers of the plasminogen KO mice over the two weeks with a significant reduction in lesion size between days 1 and 14 (*, p<0.05 by Kruskal-Wallis test with Dunn's post-hoc tests). D. H&E-stained vertical sections at the center of the liver lesion in WT (upper panels) and plasminogen-KO mice (lower panels). Arrowheads indicate granulation tissue, which was not observed in the KO mouse liver. Scale bars: 1 mm.

