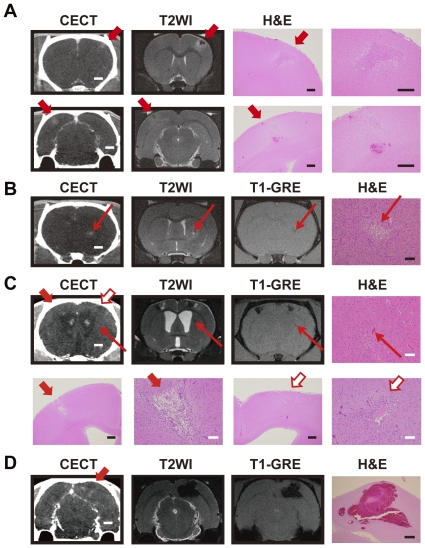
Figure 4. Comparisons of the CT and MR images of stroke lesions in the SHRSP rats.
A. Images acquired with CECT (left), T2-weighted MR (T2WI, middle), and H&E staining (right) of the same stroke areas in an SHRSP rat brain two weeks after the onset. The areas indicated by arrows are suspected loci of hemorrhagic infarction. Infarct lesions with gliosis and inflammatory cell infiltration were observed in the upper and lower H&E images (left and right panels are the same lesion at low and high magnifications, respectively). Hemorrhage (or congestion) is also seen in the lower panels. Scale bars: 2 mm (CECT); 400 µm (H&E). B. Images acquired by CECT, T2WI, and T1-weighted gradient echo (GRE), along with an H&E image of identical stroke areas in an SHRSP rat brain after 3 weeks of stroke onset. Arrows indicate suspected hemorrhagic infarction of about 0.5 mm in diameter. Gliosis and small-sized cystic cavity formation are observed in the infarct area (H&E image). Scale bars: 2 mm (CECT), 100 µm (H&E). C. Images obtained with CECT, T2WI, T1-weighed GRE, and an H&E stain of identical stroke areas in an SHRSP rat brain 4 weeks after onset. Bold arrows (red and white) in upper panels indicate suspected hemorrhagic infarction. A suspected hemorrhage of about 0.1 mm in diameter was also detected (thin arrows). The corresponding areas were analyzed by H&E staining (upper right and lower panels). The lesion areas indicated by both red and white bold arrows in the H&E images are wedge-shaped infarcts with inflammatory cell infiltration, gliosis, and cystic cavities (lower panels at low and high magnifications). Scale bars: 2 mm (CECT), 500 µm (H&E, white bars) and 100 µm (H&E, black bars). D. Images of the posterior brain of the same SHRSP rat shown in C. The bold arrow indicates a suspected hemorrhagic infarction. Scale bars indicate 2 mm (CECT) and 500 µm (H&E, lower panel).

