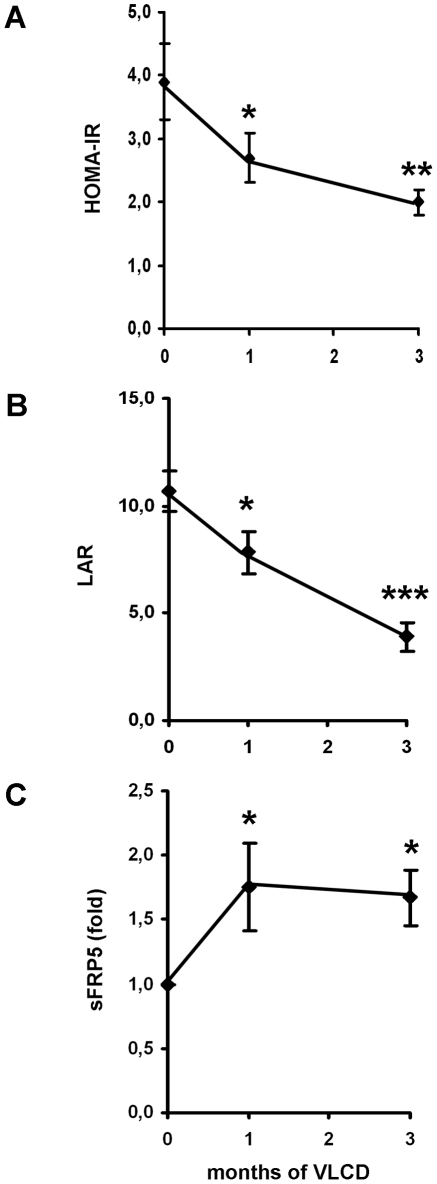
Figure 4. (A+B) Insulin resistance before, during (1 month) and after 3 month of caloric restriction: In the present study insulin resistance was measured by the HOMA-IR index (A) and the leptin-to-adiponectin ration (LAR) (B) since the later parameter has been shown to be closely correlated to measures of insulin resistance by hyperinsulinemic euglycemic clamp experiments [16].
Data are given as means±SEM of n = 23 obese human subjects during a VLCD. Significance was tested by student's t-test. (C) sFRP serum concentrations before, during (1 month) and after 3 months of caloric restriction: sFRP5 serum concentrations were determined before (0 month), during (1 month) and after (3 months) of a VLCD. In this figure the levels are shown as fold increase compared to 0 month. The raw data are given in table 2. Shown are means±SEM of n = 23 obese human subjects during a VLCD. t-test was used to test for statistical significance.

