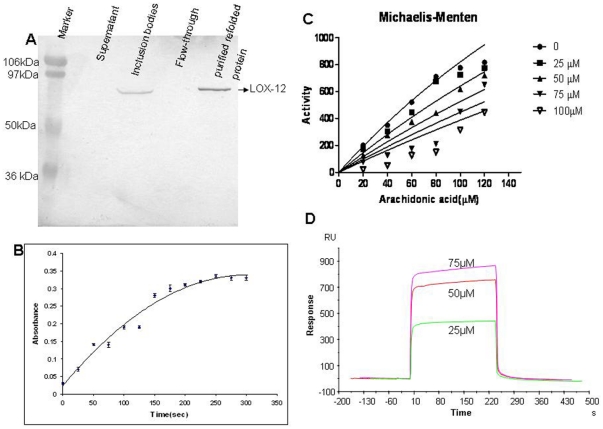
Figure 1. Western blot showing LOX-12 expression:
(A) Molecular weight marker, supernatant of bacterial extract, inclusion bodies of bacterial cell extract, flow-through of the Ni-NTA column, purified refolded protein, (B) Activity profile of purified LOX-12. (C) Michaelis-Menten plot of LOX-12 activity versus arachidonic acid concentration showing decrease in activity at different concentrations (0, 25, 50, 75,100 µM) of YWCS. (D) Sensogram showing binding of different concentrations of YWCS (25, 50 and 75 µM) on immobilized with His-LOX-12 over the Ni2+-NTA chip.

