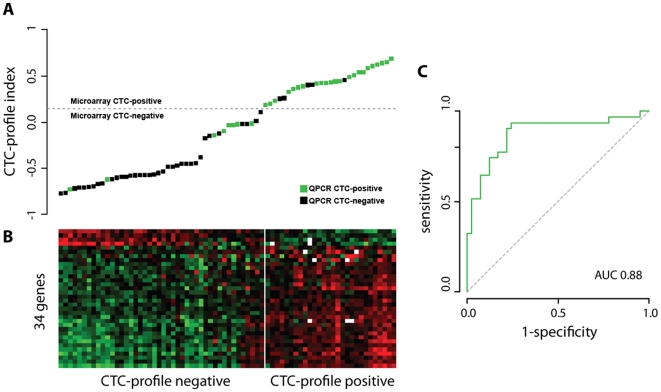
Figure 1. A gene expression profile derived from the primary tumor accurately predicts the presence of CTCs in the peripheral blood in breast cancer patients.
(A) The CTC-profile indexes of 72 breast tumor samples are highly correlative with CTC status. Samples are ordered according to CTC-profile index and colored based on CTC-status. The dashed line indicates the classification threshold with optimal sensitivity and specificity. (B) A heatmap shows the level of expression of the 34 CTC profile genes for CTC-negative and CTC-positive patients. (C) The ROC curve of CTC-profile indexes compared to actual CTC status.

