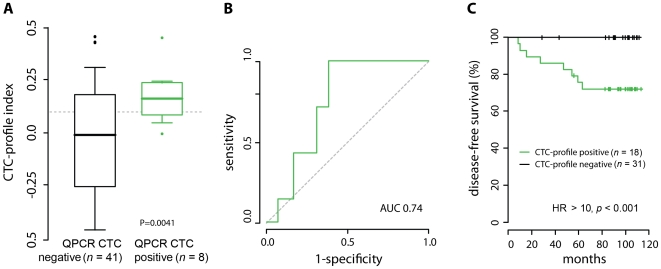
Figure 2. Independent validation of the CTC-predictive profile on 49 early-stage lymph-node negative breast cancer patients.
(A)Distribution of CTC-profile indexes for CTC-positive and CTC-negative patients. The dashed line indicates the threshold as was determined in the training cohort. (B) Validation ROC curve showing classification performance of the CTC-profile. (C) Kaplan-Meier survival curves of relapse-free survival of patients classified as CTC-positive or CTC-negative using the CTC-profile.

