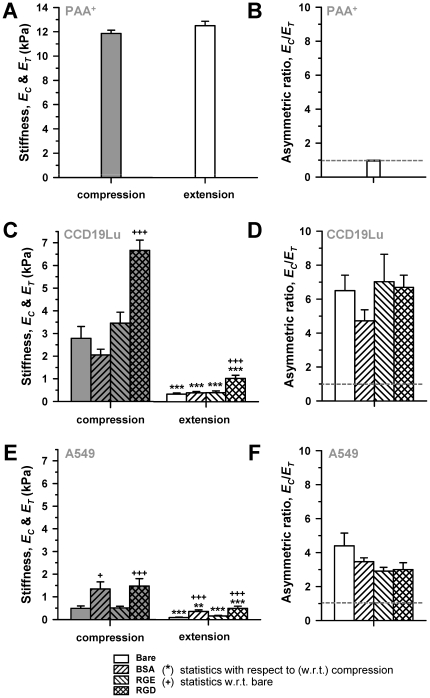
Figure 2. Local cell stiffness depends on the directionality and integrin-specificity of the applied force in lung cells but not in PAA2+ gels.
(A) Average resistance to compression (EC) and extension (ET) obtained in PAA+ gels with negatively-charged FE-AFM tips. (B) Corresponding EC/ET data. The dashed line indicates the perfectly symmetric mechanoresponse (EC = ET). (C, E) EC and ET data probed with either bare or coated FE-AFM tips on (C) CCD-19Lu fibroblasts or (E) A549 parenchymal cells. (D, F) EC/ET data corresponding to (C) and (E), respectively. The legend of the bar filling patterns shown at the bottom apply to plots A–F. *P<0.05, **P<0.01 and ***P<0.005 were determined by paired Student's t-test with respect to (w.r.t.) compression. +P<0.05, ++P<0.01 and +++P<0.005 were determined by unpaired Student's t-test w.r.t. bare.

