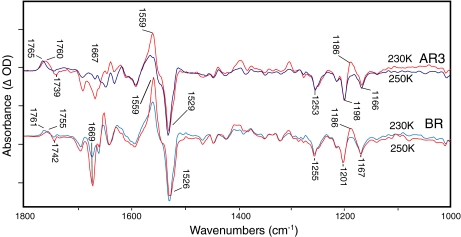
Fig. 2.
FTIR difference spectra recorded at 4 cm − 1 resolution and 230 K (blue) and 250 K (red) for AR3 and BR at pH 9 in H2O. Each spectrum represents the average of at least 20 difference spectra, with each spectrum being the average of 1,000 individual scans. Spacing of Y-axis (difference absorbance) markers correspond to 10 mOD for BR at 230 K, 1.5 mOD for BR at 250 K, 0.5 mOD for AR3 at 230 K, and 0.2 mOD for AR3 at 250 K. For lighting sequence used to obtain difference spectrum, see Section 3

