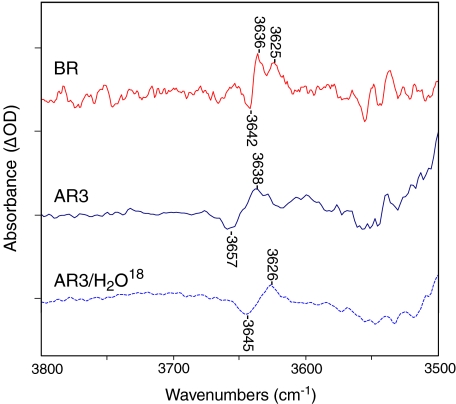
Fig. 3.
FTIR difference spectra recorded at 80 K with 4 cm − 1 resolution (same as Fig. 1 above) for BR (red), AR3 (blue solid), and AR3/H2O18 (blue dashed) in the 3,800–3,500 cm − 1 region. Each spectrum represents the average of at least 18 difference spectra, with each spectrum being the average of 1,000 individual scans. Spacing of Y-axis (difference absorbance) markers corresponds to 0.06 mOD for the AR3 spectra and 0.1 mOD for the BR spectra. For lighting sequence used to obtain difference spectrum, see Section 3

