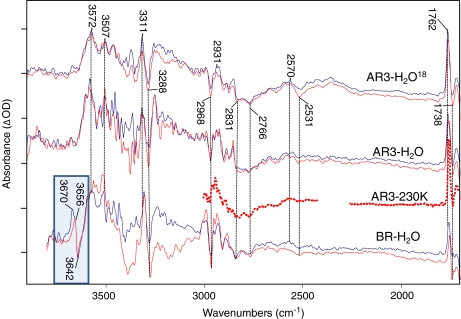
Fig. 5.
Time-resolved difference spectra for AR3 WT in H2O, AR3 WT, in H2O18, and BR WT in H2O over the spectroscopic region from 1,700 to 4,000 cm − 1. AR3 H2O and H2O18 data were recorded at neutral pH. BR WT H2O data was recorded at pH 9. All data was recorded in rapid scan mode on Bruker ifs/v66 model FTIR spectrometer at 4 cm − 1 resolution, and 320-kHz scanner velocity (see Section 3). Laser luminosity was less than 6 mJ/cm2 at the sample with repetition rate less than 0.5 Hz to prevent sample burnout. Blue traces represent the early averages (zero to 40 ms after the laser excitation) where the sample is predominantly in the M state as evidenced by the 1,762 cm − 1 bands. The red traces represent later averages (60 ms to several hundred ms) where the M state has decayed sufficiently into the N photointermediate. These photointermediate assignments are supported by the intensity of the 1,180 cm − 1 bands (not shown). Spacing of the Y-axis (difference absorbance) markers corresponds to 0.1 mOD for AR3 H2O M as well as AR3 H2O18 M and N; 0.05 mOD for AR3 H2O N and BR H2O M; and 0.025 mOD for AR3 230K and BR H2O N spectra. Dotted line shows low-temperature spectrum of AR3 at 230K below 3,000 cm − 1 (see Figs. 2 and 4 captions for more detail). Spectral region obscured by C02 absorbance band between 2,250 and 2,350 cm − 1 is not shown

