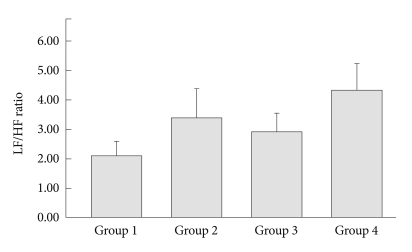
Figure 3.
Comparison of the LF/HF ratio between the four OSAS groups. The ratio was significantly different (F=4.64, p=0.004) when adjusted by systolic blood pressure (SBP), diastolic blood pressure (DBP), body mass index (BMI) and sleep efficiency (SE). The contrast test further showed that Group 1 was significantly different from Group 4 (p<0.001). Similarly, Group 3 was significantly different from Group 4 (p=0.040). OSAS: obstructive sleep apnea syndrome, LF/HF ratio: Low frequency/High frequency ratio.

