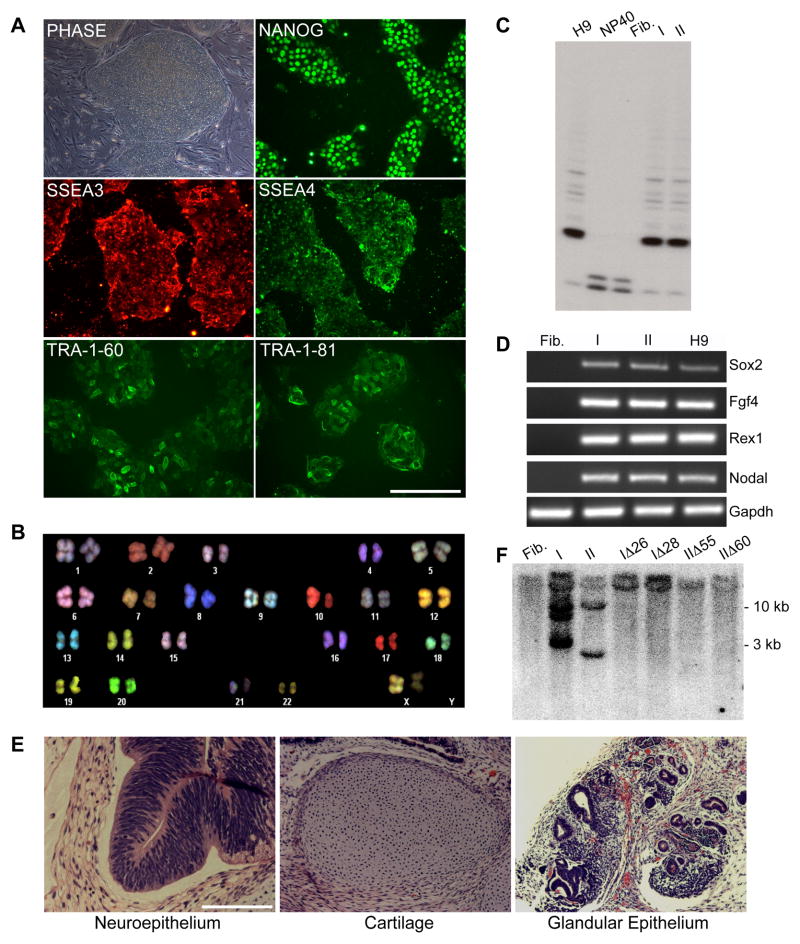
Figure 1. Characterization of sickle cell iPS clones I and II.
A. Phase contrast image of iPS clone I grown on feeder cells and immunofluorescence staining images of feeder-free cultures.
B. SKY-FISH analysis of a representative normal diploid metaphase spread of iPS clone I.
C. Telomerase activity assay: Fibroblasts show no telomerase activity as in the negative control (NP40); conversely iPS clones I and II show a pattern similar to the one observed in H9 ES cells (positive control).
D. RT-PCR analysis of pluripotency-associated genes in patient parental fibroblasts, iPS clones I and II, and H9 ES cells.
E. H&E staining of teratoma derived from iPS clone I showing tissues representative of all three germ layers.
F. Southern Blot analysis using a c-myc probe showing the number of STEMCCA cassette integrations in parental iPS clones I and II and four derivative clones transfected with Cre recombinase. Clones I and II show 3 and 2 integrations, respectively, while clones transfected with Cre recombinase (IΔ26, IΔ28, IΔ55, and IΔ60) show no integrations, similar to what is observed in uninfected fibroblasts.
Abbreviations: Fib.: Fibroblasts from sickle cell anemia patient 1; I: iPS clone I; II: iPS clone II; NP40: negative control for telomerase activity.

