Figure 2.
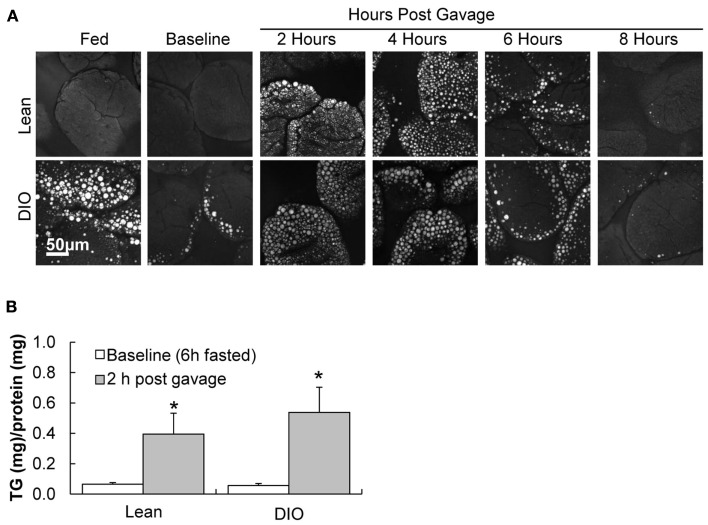
TG storage in enterocytes of DIO and lean mice in response to dietary fat. (A) Representative CARS images of TG storage in enterocytes of the upper jejunum of fed (2 h post food removal at beginning of light cycle), baseline (6 h fast), 2, 4, 6, and 8 h post oil bolus in lean and DIO mice (6 weeks of HF feeding). (B) TG concentration in duodenum of lean and DIO mice (6 weeks of HF feeding) at baseline (6 h fast) and 2 h post oil bolus. Data are represented as mean ± SEM. Asterisks denote significant differences in TG concentration between baseline and 2 h post oil bolus of respective groups (Two-way ANOVA, Tukey post hoc test), P < 0.05, n = 4 mice.

