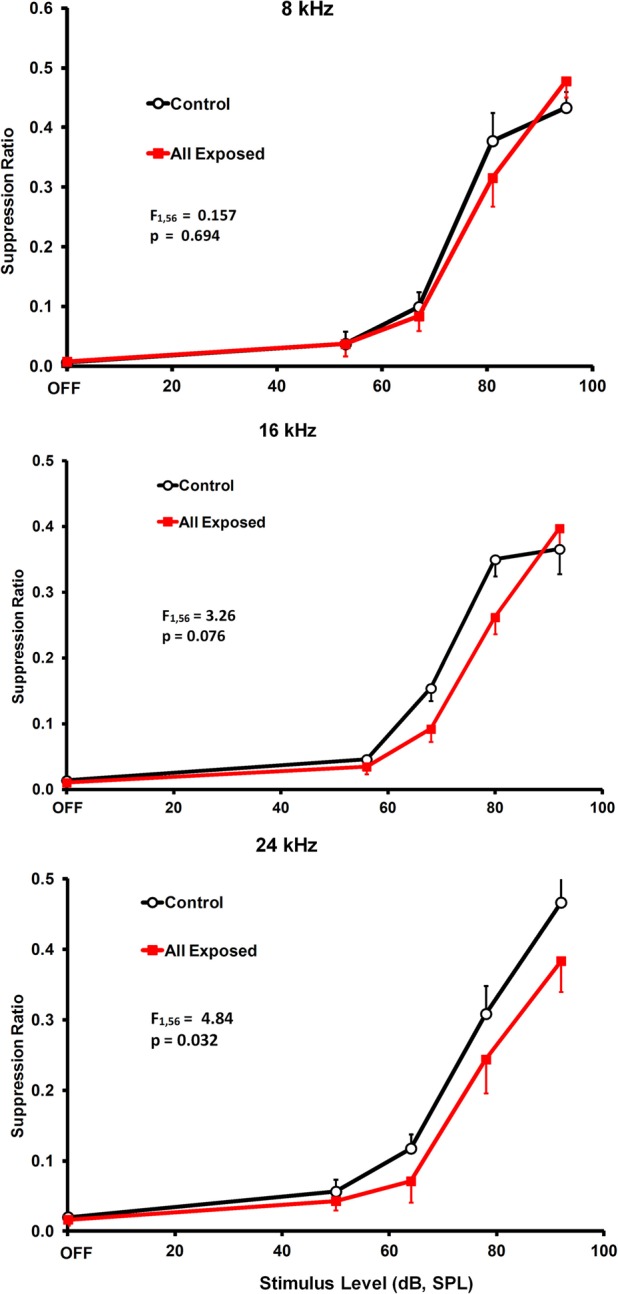
Figure 4.

Frequency-specific group evidence of tinnitus. The statistics in each panel represent a comparison of exposed and unexposed groups for stimulus levels above the OFF setting. As in Figure 3, relative lever pressing is shown on the y-axis and test stimulus across levels is shown on the x-axis. Error bars show the standard error of the mean.
