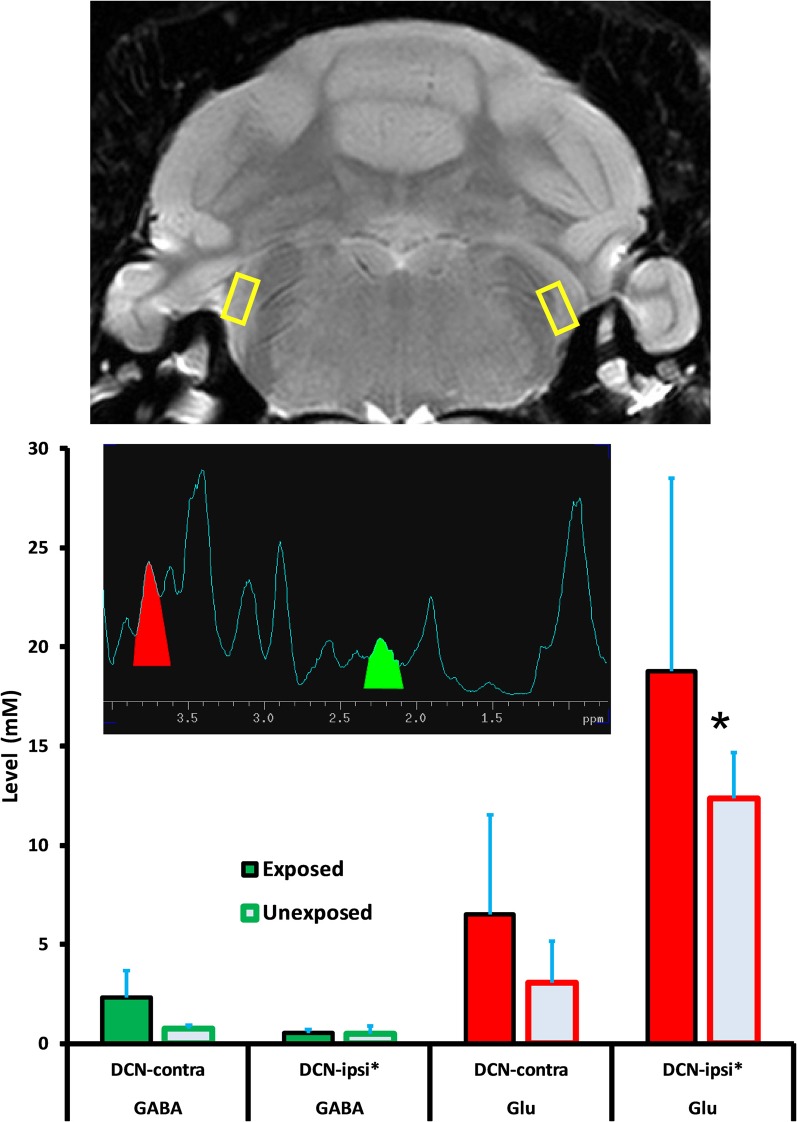
Figure 5.
GABA and Glu levels (mM/ml) in the dorsal cochlear nucleus (DCN) of exposed and unexposed rats. Top panel: size and location of the VOI; Mid panel: a typical individual 1H-MRS; Lower panel: group average GABA and Glu levels. Error bars show the standard error of the mean. Asterisk next to the axis label indicates the direct pathway with respect to the trauma-exposed ear. Asterisk next to the data bar indicates statistical significance (p ≤ 0.05).

