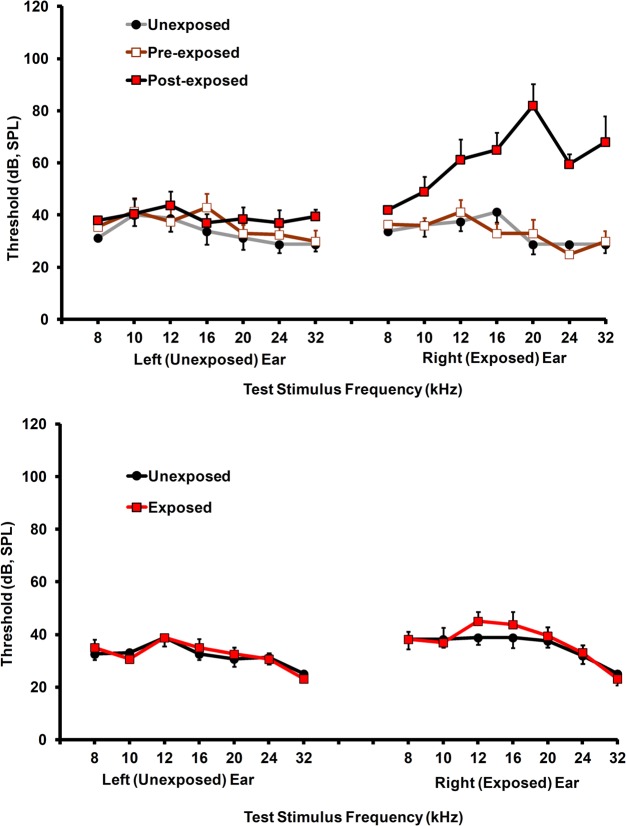
Figure 9.
Auditory brainstem response thresholds for exposed and unexposed rats. Top panel: thresholds before and immediately after acoustic exposure. Significant threshold elevation was evident only in the exposed ear. Bottom panel: thresholds prior to spectroscopy show normal levels in both groups. Error bars show the standard error of the mean.

