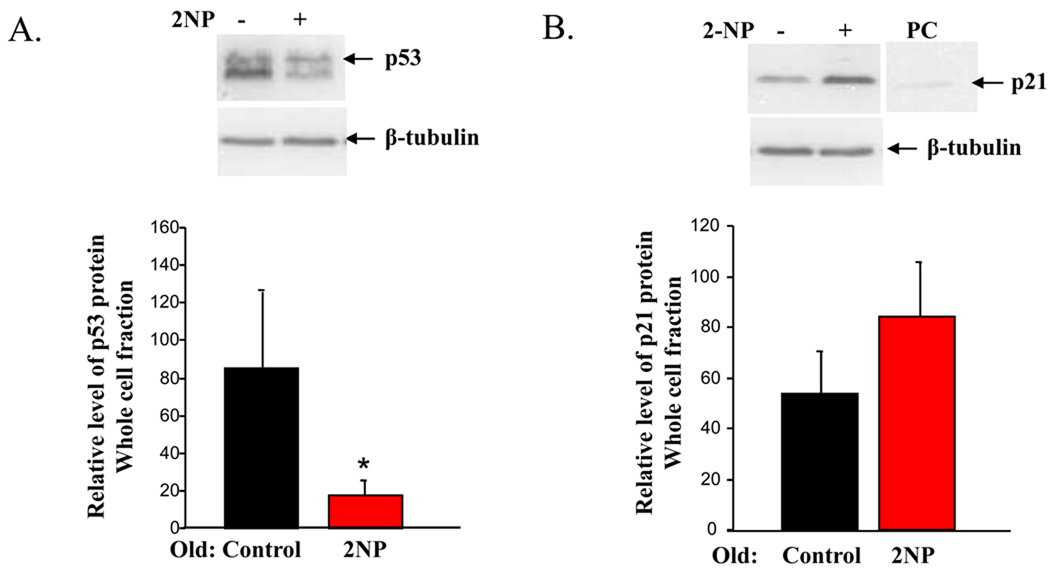
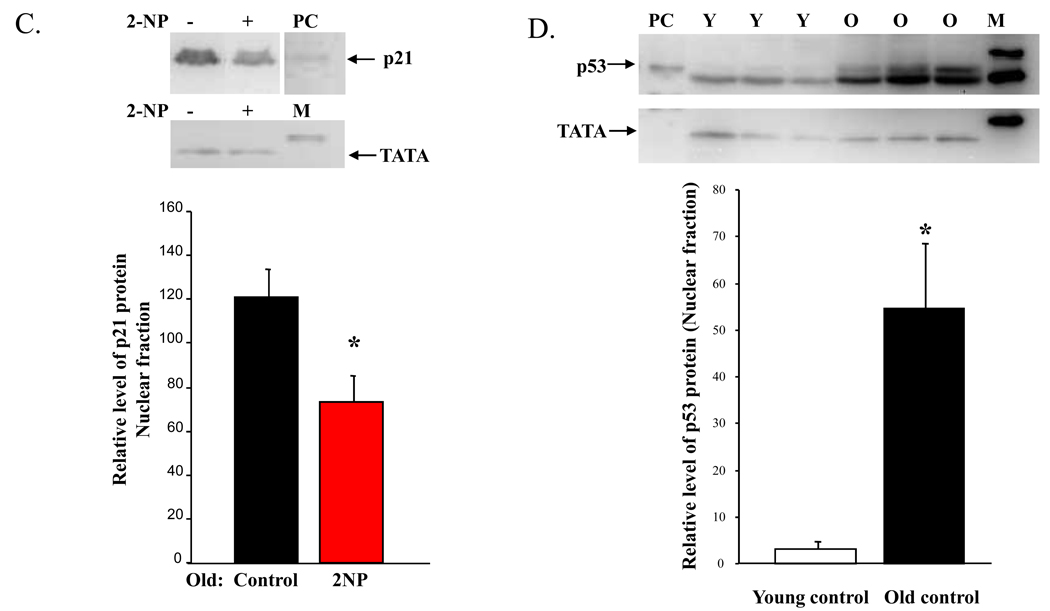
Figure 1. Differential induction and cellular localization of p53 and p21 protein in response to 2NP in young and old animals.
Whole cell and crude nuclear extracts were isolated from liver tissue of young (4–6 months) and old (24–28 months) mice injected with 2NP and their non-injected counterparts as described in Materials and Methods. Protein levels were normalized to µg protein loaded on gel and verified by gelCode and memCode staining. Representative images are shown. A. Loss of p53 response in old animals exposed to 2NP. Levels of p53 protein were determined in whole cell extracts from old animals untreated and treated with 2NP. β-tubulin serves as loading control. Values represent an average (±SEM) for p53 data obtained from five animals in each group. −, no 2NP; +, 2NP injected; (*) value significantly different from control at p<0.05. B. Induction of p21 protein in old animals exposed to 2NP. Levels of p21 protein were determined in whole cell extracts from old animals untreated and treated with 2NP. β-tubulin serves as loading control. Values represent an average (±SEM) for p21 data obtained from five animals in each group. −, no 2NP; +, 2NP injected. C. Loss of nuclear p21 protein in old animals exposed to 2NP. Levels of p21 protein were determined in crude nuclear extracts from old animals untreated and treated with 2NP. TATA1 binding protein serves as loading control and marker of subcellular fractionation. Values represent an average (±SEM) for p21 data obtained from five animals in each group. −, no 2NP; +, 2NP injected. Positive control: (*) value significantly different from control at p<0.05. D. Aging results in accumulation of p53 in the nucleus. Levels of p53 protein were determined in crude nuclear extracts from young and old control animals (untreated). TATA1 binding protein serves as loading control and marker of subcellular fractionation. Values represent an average (±SEM) for p53 data obtained from three animals in each group. PC= positive control; M=marker; Y=young; O=old.


