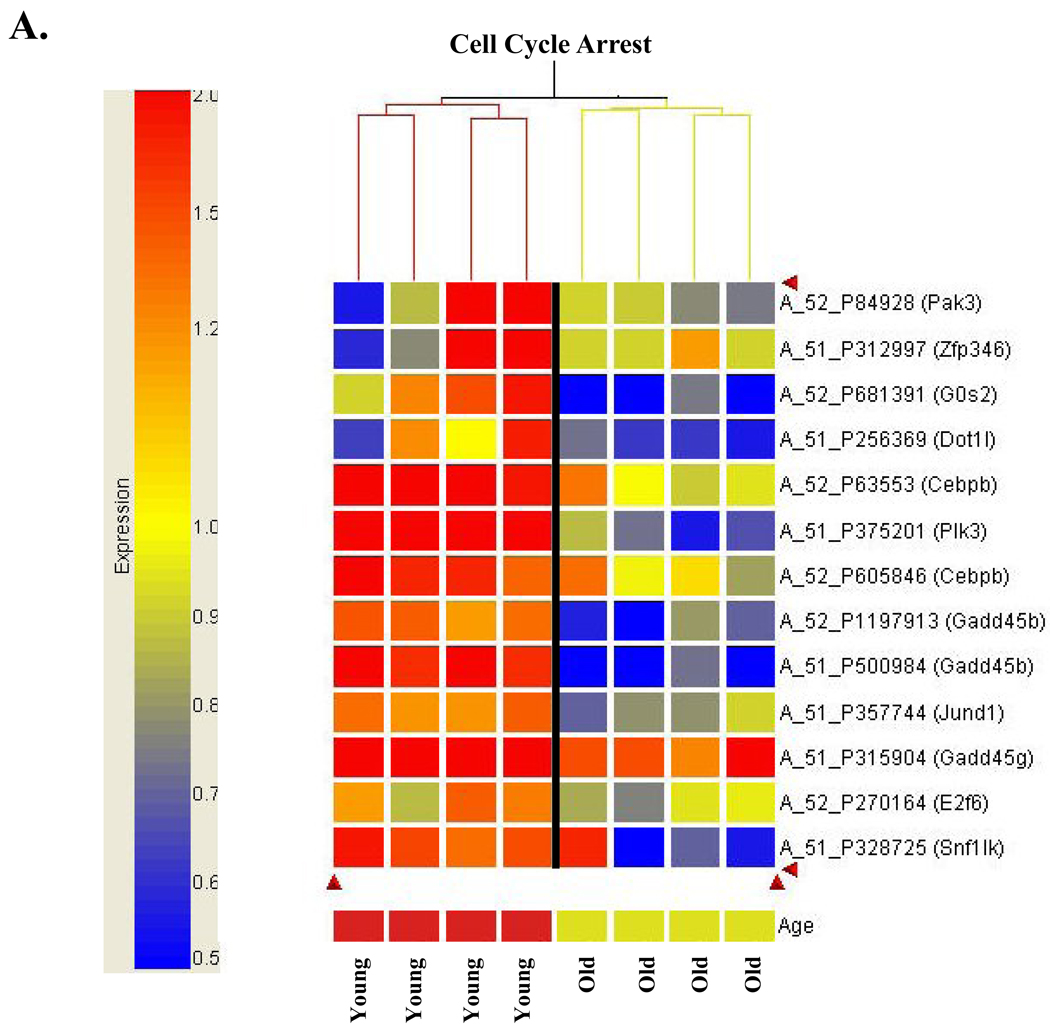
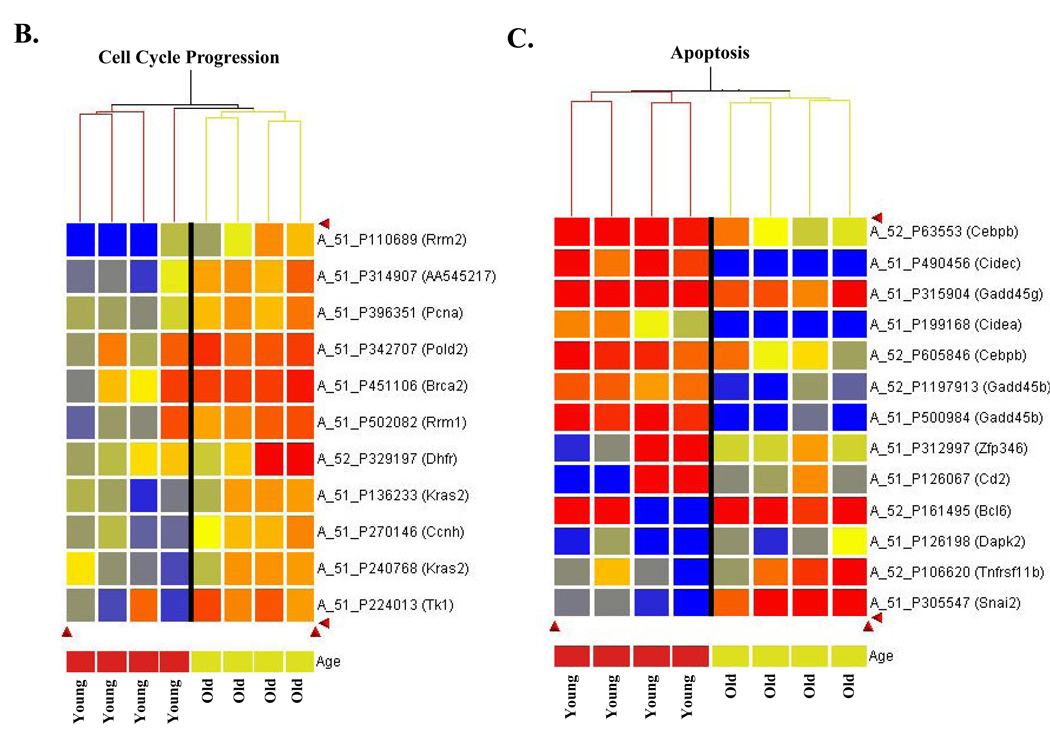
Figure 4. Cluster analysis of differentially expressed genes demonstrates differential response to oxidative stress in old compared to young animals.
Hierarchical clustering was performed as described in Materials and Methods. A. Aging alters expression of cell cycle arrest genes in response to oxidative stress. Agilent probe number and gene name are indicated. Expression scale is presented to left of cluster analysis to indicate magnitude of expression differences. B. Aging alters expression of cell cycle progression genes in response to oxidative stress. Agilent probe number and gene name are indicated. C. Aging alters expression of genes involved in apoptosis following oxidative stress. Agilent probe number and gene name are indicated. Expression scale: Red heatmap coloring indicates increased gene expression in response to 2NP treatment, relative to control, while blue represents a decrease in expression. Presentation of a gene more than once indicates that distinct probes for the same gene showed the dame


