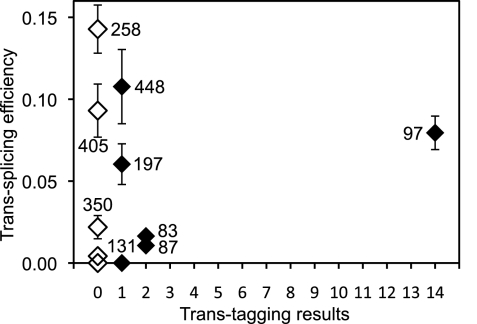
FIGURE 6.
Comparison between trans-splicing efficiency and trans-tagging results. The measured trans-splicing efficiency for each splice site is plotted against the number of times that the splice site was found in 66 product sequences obtained with the trans-tagging assay (filled diamonds). Open diamonds denote splice sites that were not found by the trans-tagging assay. Note that eight of the 18 sequences are clustered at the origin of the plot.

