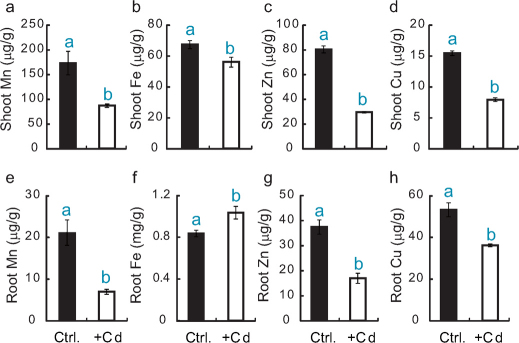
Figure 1. Metal concentrations of rice plants grown in the presence of Cd.
Shoot and root metal concentrations under control conditions (Ctrl.) or in the presence of 10 µM Cd (+Cd). (a, e) Mn, (b, f) Fe, (c, g) zinc, and (d, h) copper concentrations. Error bars represent the SD. Columns bars followed by different letters are statistically different according to analysis of variance followed by Student-Newman-Keuls (SNK) test (a, p = 0.0034; b, p = 0.0074; c, p = 0.0000; d, p = 0.0000; e, p = 0.0017; f, p = 0.0069; g, p = 0.0005; h, p = 0.0010); n = 3.

