
Fig. 1.
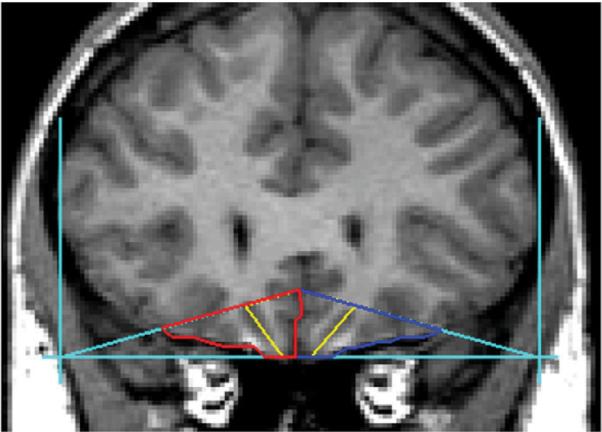
The boundaries and landmarks for the orbitofrontal cortex, right, left and total, followed the guidelines established by Lacerda et al (2003). Outlines for the left OFC are seen in blue, with the right OFC in red. The yellow line depicts the lateral and medial portions of the OFC in each hemisphere.