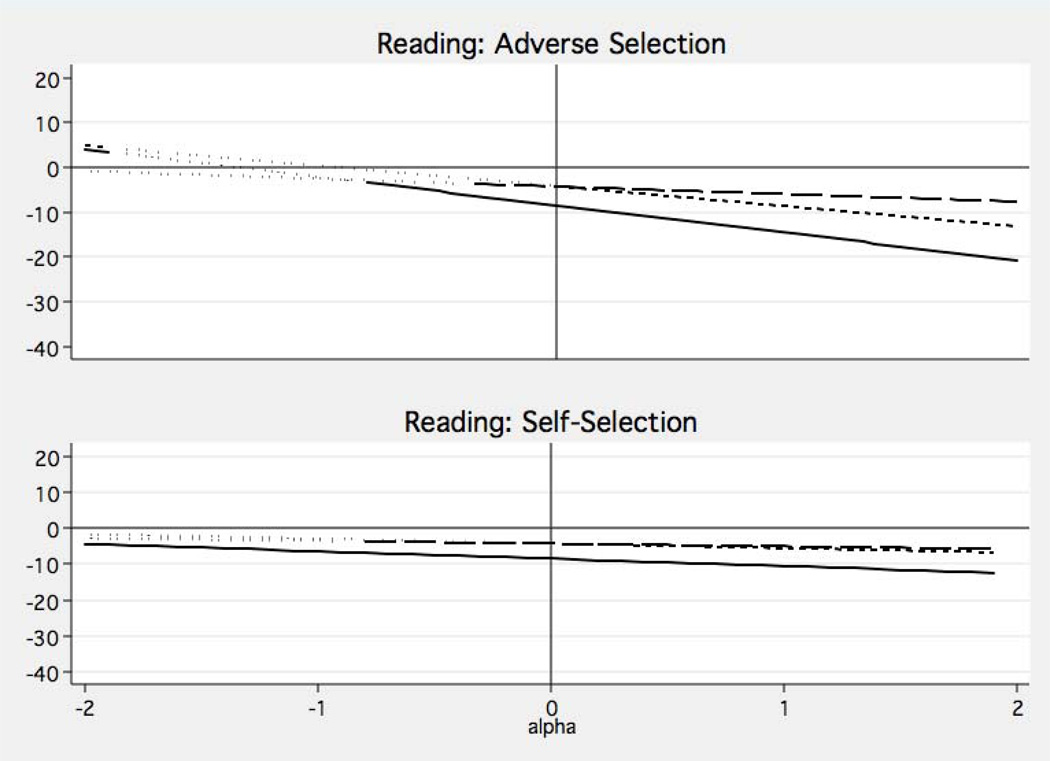
Figure 4.
Sensitivity analyses for the robustness of neighborhood effects on child reading scores to unobserved selection bias of various strengths (α). Panel A assumes adverse selection into poor neighborhoods (α<0) and adverse selection into non-poor neighborhoods (α>0). Panel B assumes positive self-selection into each respondent’s observed neighborhood type for approximately α>-1. Dotted lines give point estimates for the direct causal effect of parent’s neighborhood poverty. Dashed lines give point estimates for the causal effect of child’s own neighborhood poverty. Solid lines give point estimates for the joint effect of parent’s and child’s multigenerational neighborhood poverty. Bold line segments contain point estimates that are statistically significant at p<0.05. Thin line segments contain point estimates that are not statistically significant. Combined sample of black and white families. Neighborhood poverty >20%.

