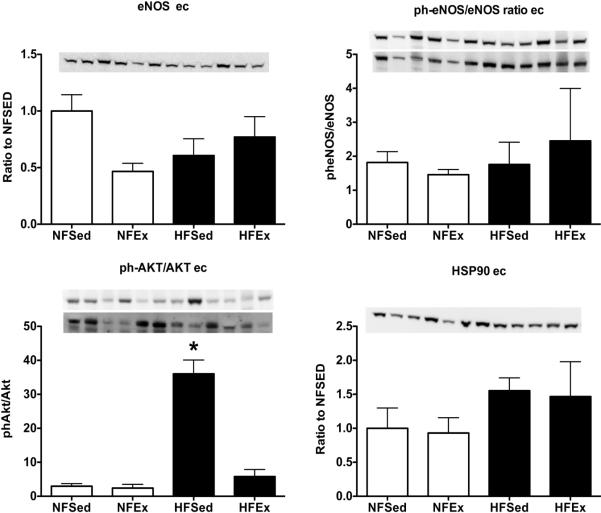
FIGURE 4.
Immunoblot analysis of expression of markers related to NO production/ bioavailability in samples of left anterior descending (LAD) coronary artery endothelial cell scrapes from normal fat diet sedentary (NFSed) and exercise (NFEx); high fat diet sedentary (HFSed) and exercise (HFEx). Representative blots are presented at the top of each set of mean values presented as bar graphs. The band sequence on the sample blots, from left to right, for all four antibodies is in the following order: NFEx, NFSed, HFEx, and HFSed repeated 3 times per gel. Data are expressed relative to NFSed values for endothelial nitric oxide synthase (eNOS) content of LAD endothelial cells. Phospho-eNOS content expressed relative to total eNOS content in LAD endothelial cells (upper sample blot: ph-eNOS; lower sample blot: eNOS after stripping for ph-eNOS). Phospho-AKT content expressed relative to total AKT content in LAD endothelial cells (upper sample blot: ph-AKT; lower sample blot: AKT after stripping for ph-AKT). Heat shock protein 90 (HSP90) content LAD endothelial cells. Values are means ± SE. * = HFSed value significantly greater than other groups p < 0.05.

