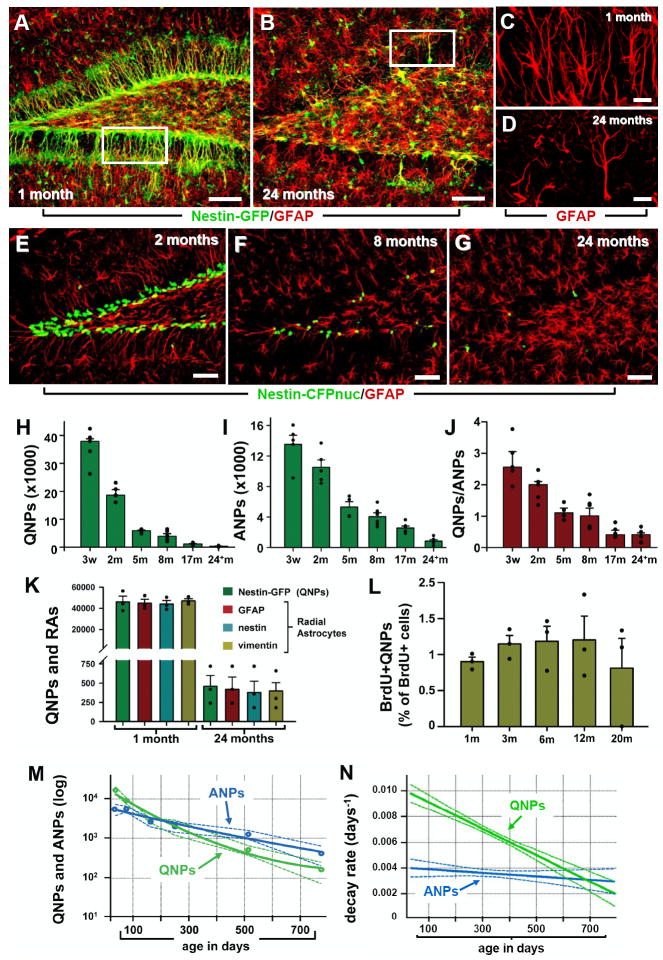
Fig. 3. Age-dependent decrease in the number of hippocampal stem and progenitor cells.
(A-D) Nestin-GFP- and GFAP-positive cells in the DG of 1 month old (A, C) and 24 month old (B, D) Nestin-GFP mice. C and D correspond to the boxed regions in A and B, respectively, and show GFAP-positive radial astrocyte-like cells in 1 and 24 months old mice.
(E-G) QNP and ANP cells (green nuclei) in the DG of 2, 8, and 24 month old Nestin-CFPnuc mice. Note the increase in the number of GFAP-positive stellar astrocytes with age in A, B, E-G. Color channels are indicated. Scale bar is 50μm in A, B, E-G, and 25μm in C, D.
(H-J) Quantification of age-related changes in QNPs (H), ANPs (I), and the QNP/ANP ratio (J) in Nestin-CFPnuc animals (numbers, also presented in Table S2, are given as mean±SEM; at least 4 animals per group). In this and other figures each animal is represented by a dot on the graph (such dots can overlap for close values).
(K) Quantification of Nestin-GFP QNPs and radial astrocyte-like cells (RAs) stained for GFAP, nestin, and vimentin in 1 and 24 months old Nestin-GFP animals.
(L) Percentage of BrdU-labeled QNPs among all QNP cells in Nestin-GFP mice of different ages after a single pulse of BrdU (150mg/kg, analyzed 24hr later).
(M, N) Polynomial fits of the QNP and ANP content (M) and the disappearance (decay) rates (N) of ANPs and QNPs. Dotted lines show a range corresponding to one standard deviation. The solid lines are interpolations.
See also Table S2.

