Fig. 5.
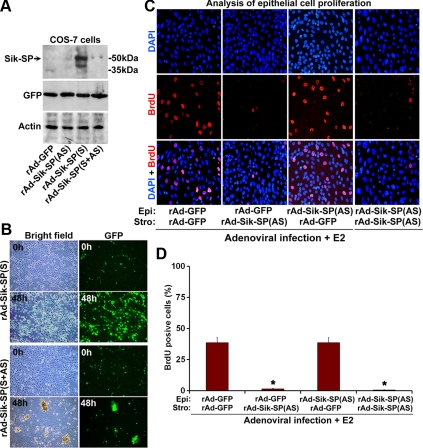
Functional analyses of Sik-SP on cellular viability and on E2-driven epithelial cell proliferation in a primary uterine coculture. A, Analysis of the effects mediated by Sik-SP adenoviruses in Cos-7 cells. Cos-7 cells were infected with adenoviruses (10 pfu) for GFP (as a control), Sik-SP(AS), Sik-SP(S), or mixture (1:1 ratio) of Sik-SP(S+AS) for a period of 48 h. Cell extracts were then collected for analyses of Sik-SP, GFP, and actin expression by Western blotting. B, Cell viability in Cos-7 cells after serum deprivation. Cos-7 cells were subjected to infection with GFP (data not shown), Sik-SP(AS) (data not shown), Sik-SP(S), or Sik-SP(S+AS) adenoviruses at 10 pfu level as indicated above. After 12 h after infection, cells were subjected to serum deprivation, as described in Materials and Methods, and continued the culture for an additional 48-h period. Cells at indicated times were visualized by fluorescence microscopy using bright field or GFP. Note, Sik-SP(S) virus, as opposed to Sik-SP(S+AS), control GFP (data not shown), or Sik-SP(AS) (data not shown), provides cellular protection, as judged by the maintenance of growth/viability even after serum deprivation. C, The role of Sik-SP in the E2-treated primary uterine coculture system. Epithelial (Epi) and stromal (Stro) cells were separately infected with rAd-GFP (control) and/or rAd-Sik-SP(AS) before the initiation of coculture and the treatment of E2 (10 nm), as described in Materials and Methods. Confocal analysis of epithelial cell proliferation was determined by the incorporation of BrdU (red). 4′,6-diamidino-2-phenylindole (DAPI) (blue) was used to stain all nuclei. Stromal cells did not reveal any proliferation under this condition. D, Quantitative analysis of cellular proliferation as shown in C. The data presented here are after the analysis of at least 1000 cells from each group. The error bars represent se. *, Values are statistically different against the control group (P < 0.01, ANOVA followed by Newman-Keul's multiple range test). These experiments were repeated at least three times with similar results.

