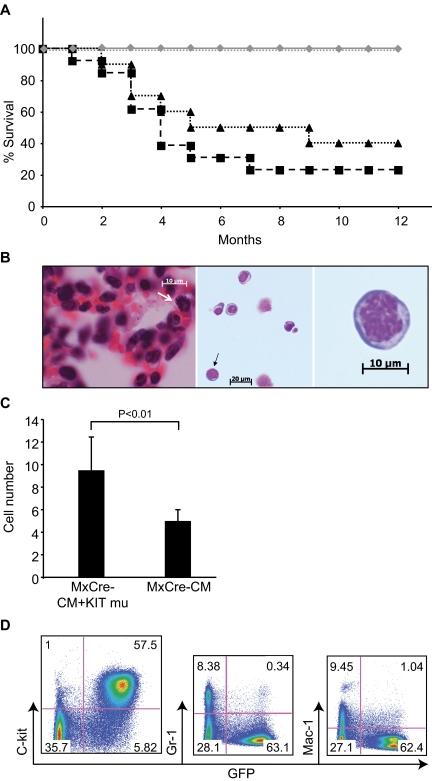
Figure 3.
Leukemia development in mice transplanted with Cbfb+/56m; Tg(Mx1-Cre)/KITD816Y/V BM cells. (A) Survival curves of transplanted mice. Black dashed line with squares indicate mice transplanted with Cbfb+/56m; Tg(Mx1-Cre)/KITD816Y BM cells (N = 13); black dotted line with triangles, mice transplanted with Cbfb+/56m; Tg(Mx1-Cre)/KITD816V BM cells (N = 10); gray line with diamonds, mice transplanted with Cbfb+/56m; Tg(Mx1-Cre)/KIT or Cbfb+/56m; Tg(Mx1-Cre)/GFP BM cells (N = 18); and gray dotted line, mice transplanted with KIT (both WT and D816 mutants)–transduced WT BM cells (N = 15). (B) H&E stained lung tissue (left) and Wright Giemsa–stained leukemia cells in PB (middle and right, respectively) from a Cbfb+/56m; Tg(Mx1-Cre)/KITD816Y leukemic mouse. White arrow in the left panel indicates a cell in mitosis. Black arrow in the middle panel indicates a cell that has been enlarged in the right panel. (Imager D2, Zeiss; 20×, 40×, and 63× plan-Apochromat objective lenses; AxioVision 4.8 acquision software; AxioCam HRC, Zeiss). (C) Mitotic cell count from leukemic spleen sections of Cbfb+/56m; Tg(Mx1-Cre) mice (MxCre-CM; N = 3) and Cbfb+/56m; Tg(Mx1-Cre)/KITD816Y (MxCre-CM + KIT mu; N = 3) mice. (D) FACS analysis of PB cells from a leukemic mouse transplanted with Cbfb+/56m; Tg(Mx1-Cre)/KITD816Y BM cells.

