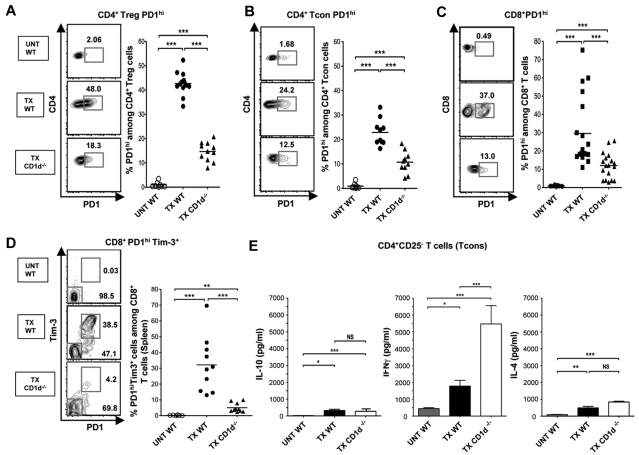
Figure 3.
NKT cells regulate PD-1 and IFNγ expression of CD4+ Tcon cells and PD-1 and Tim-3 of CD8+ T cells. (A-C) Representative FACS patterns of CD4 versus PD-1 on gated Treg (A), CD4 versus PD-1 on gated CD4+ Tcons (B), or CD8 versus PD-1 on gated CD8+ T cells (C), and percentages of PD-1hi cells among subsets from untreated WT (UNT WT, n = 8) or from WT or CD1d−/− transplant recipients at day 19 after marrow transplantation (TX WT, n = 12; TX CD1d−/−, n = 18). (D) Representative FACS patterns, and percentages of PD-1hiTim-3+ cells among gated CD8+ T cells from untreated WT (UNT WT, n = 6) or from WT or CD1d−/− transplant recipients at day 19 after marrow transplantation (TX WT, n = 10; TX CD1d−/−, n = 11). Comparison of means (Student 2-tailed t test) gave P values shown on the panels; NS > 0.05, *P < .05, **P < .01, ***P < .001. (E) Mean (± SEM) IL-10 (left panel), IL-4 (right panel), and IFNγ (middle panel) concentrations in supernatants of sorted CD4+CD25− Tcon cells, after 48 hours of culture with PMA/ Ionomycin from untreated WT BALB/c mice (UNT WT, n = 15 mice), WT BALB/c mice given transplants (TX WT, n = 27 mice), and CD1d−/− BALB/c mice given transplants (TX CD1d−/−, n = 20 mice). Data are combined from 3 or 4 independent experiments with 2 to 3 wells in each experiment. NS, not significant, P > .05; * P < .05, ** P < .01, *** P < .001 (Student 2-tailed t test of independent means). Culture supernatants from Treg cells without PMA/ionomycin had less than 20 pg/mL of IFNγ, IL-4, or IL-10.

